The Incrementality Tests module within AIM enables advertisers to measure the true incremental Return on Ad Spend (iROAS) of their marketing campaigns through controlled experiments. Rather than relying on correlation-based attribution models — which show correlation but cannot prove causation — Incrementality Testing uses a Pulse testing methodology to determine which conversions would not have occurred without a specific marketing intervention, providing causal proof of campaign impact.
This feature was designed to transform what was previously a manual, bespoke service requiring coordination between Customer Success and Data Science teams into a fully self-service workflow. Advertisers can now configure, execute, and review incrementality tests autonomously — with no Kochava internal coordination required.
Using Incrementality Tests, you can:
- Configure and run self-service Pulse tests without manual coordination
- Measure incremental lift across multiple conversion events (e.g., installs, purchases, revenue) in a single test
- Validate your AIM model’s Incrementality Factor with real-world causal data
- Generate AI-powered summaries and board-ready reports to justify marketing budgets to stakeholders
- Export results to CSV for external analysis and presentation
Navigating to Incrementality Tests
- From the left-hand navigation panel, expand AIM MMM.
- Click Incrementality Tests.
- The Incrementality Tests list page will load, displaying all tests for the currently selected advertiser account.
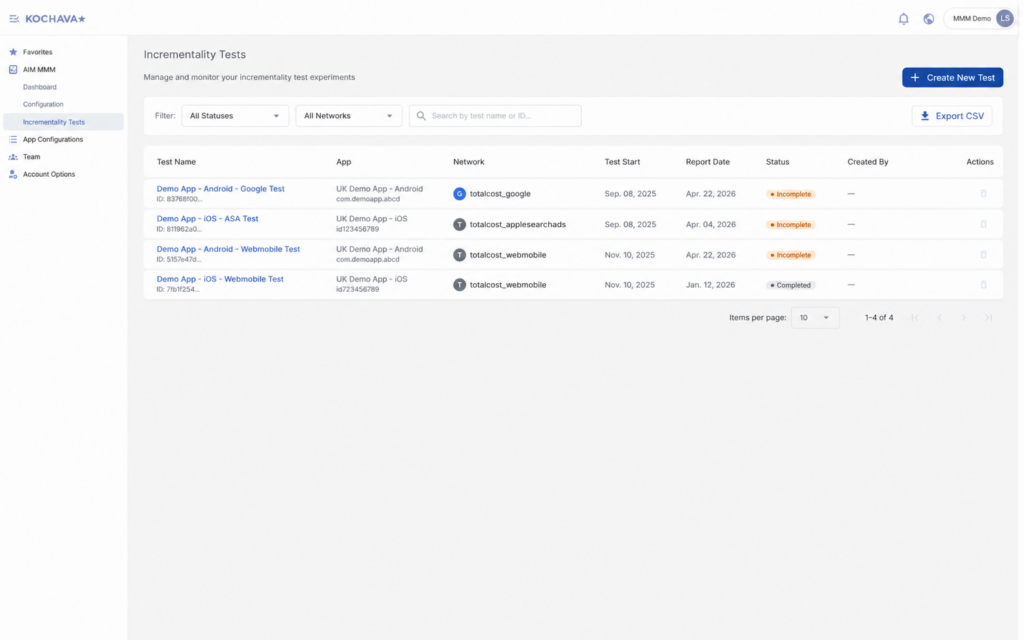
Incrementality Tests Page
The Incrementality Tests page is organized into two primary areas: the Filter & Search Bar at the top and the Test List Table below it.
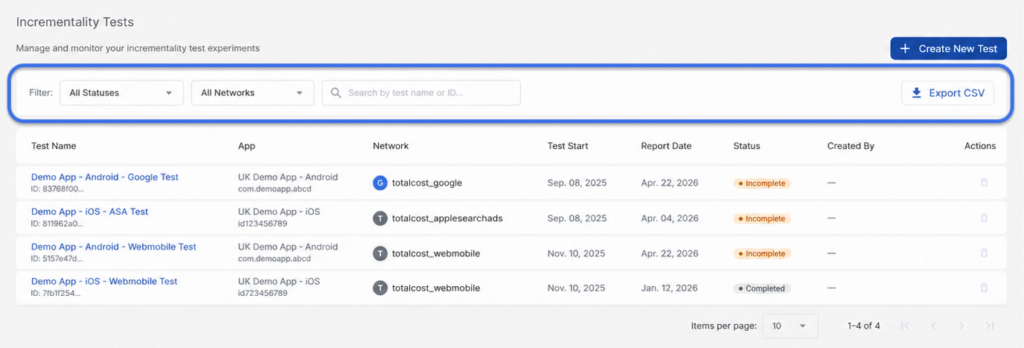
Filter & Search Bar
The filter bar provides three controls for narrowing the test list, along with an export option:
| Control | Description |
|---|---|
| Status Filter | Filter tests by lifecycle status: All Statuses, Scheduled, Running, Completed, Paused, Cancelled, or Incomplete. |
| Network Filter | Filter tests by the advertising network associated with each test (e.g., Google, Apple Search Ads, Facebook). |
| Search | Search by test name or test ID. Results update as you type. |
| Export CSV | Export the currently filtered test list to a CSV file (up to 1,000 rows). |
Test List Table
The test list table displays all incrementality tests for the current advertiser. Each row includes the following columns:
| Column | Description |
|---|---|
| Test Name | The user-defined name of the test. Clicking the name navigates to the test results page. The truncated Test ID is displayed beneath the name. |
| App | The app associated with the test, including the bundle ID. |
| Network | The advertising network being tested, displayed with the network’s icon. |
| Test Start | The date the test began (or is scheduled to begin). |
| Report Date | The estimated date results will be available — 7 calendar days after the test end date at 00:00 UTC. |
| Status | The current lifecycle status of the test, displayed as a colored badge. |
| Created By | The user who created the test. |
| Actions | Available actions for the test (e.g., Delete icon). |
Sorting: Click any column header to sort the table by that column. The active sort column is displayed in bold with an arrow icon (↑ for ascending, ↓ for descending). The default sort is creation date, descending (newest first).
Pagination: Controls at the bottom of the table allow you to adjust the number of results per page (10, 25, 50, or 100) and navigate between pages. A result count displays the current range (e.g., “Showing 1–10 of 47 results”).
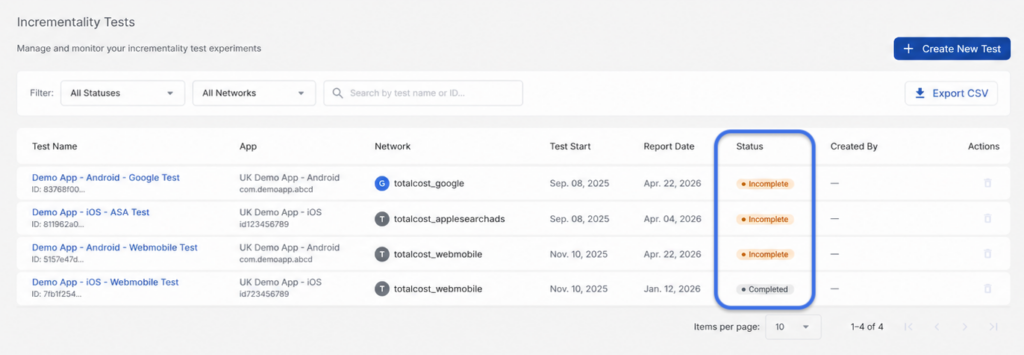
Test Statuses
Tests move through a defined lifecycle. The table below describes each status and its meaning.
| Status | Badge Color | Description |
|---|---|---|
| Scheduled | Blue | The test has been created and is waiting for the configured start date. |
| Running | Green | The test is actively in progress; data is being collected across ON and OFF periods. |
| Completed | Green | All test periods have finished. Results will be available 7 calendar days after the test end date at 00:00 UTC. |
| Paused | Yellow | The test has been manually paused and is not currently collecting data. It can be resumed. |
| Cancelled | Gray | The test was manually stopped and cannot be resumed. Partial results may still be viewable. |
| Incomplete | Orange | The test completed but results may be partial — typically occurs when the associated campaign was deleted or archived before or during the test. |
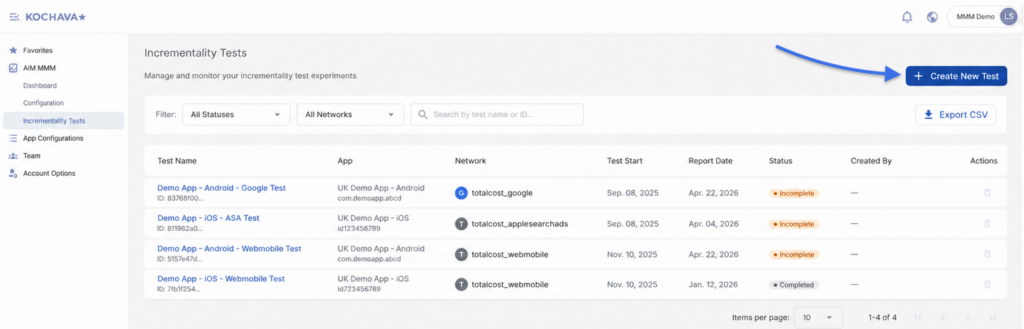
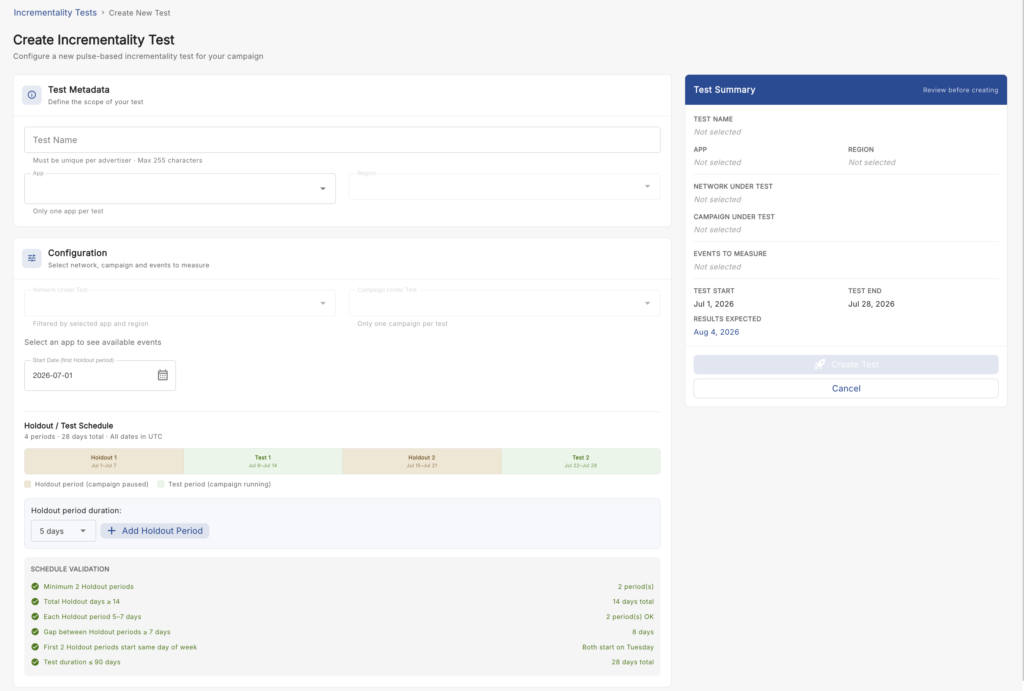
Creating a New Incrementality Test
To create a new test, click the Create New Test button in the upper-right corner of the Incrementality Tests page.
The test creation form walks you through four steps. All steps must be completed before the test can be submitted.
Step 1: Test Metadata
Configure the scope of the test by completing the following required fields:
| Field | Description | Validation |
|---|---|---|
| Test Name | A unique, descriptive name for the test (e.g., “Q2 2026 Google UAC Pulse Test”). | 1–255 characters. Must be unique per advertiser account. |
| App | The single app to test. Always a single-select dropdown — incrementality tests are scoped to exactly one app, even if your platform context includes multiple apps. | Required. Exactly one app. |
| Region | The geographic region for the test (e.g., US, CA, UK). Populated based on the selected app. | Required. |
| Network | The advertising network to test (e.g., Google, Facebook, Apple Search Ads). Populated based on the selected app and region. | Required. |
| Campaign | The specific campaign to pause during OFF periods. Populated based on the selected network. | Required. One campaign per test. |
How cascading dropdowns work: Selecting an app populates the Region dropdown. Selecting a region populates the Network dropdown. Selecting a network loads the Campaign dropdown. Changing any upstream selection resets all fields below it.
Platform compatibility: The network dropdown automatically filters out incompatible network and platform combinations. For example, Apple Search Ads will not appear for Android apps, and Google Play Store will not appear for iOS apps.
Step 2: Event Selection
Select the conversion events from your sales funnel that you want to measure incrementality for.

- Events are sourced from your AIM model’s tracked event configuration.
- You can select up to 20 events per test (e.g., Install, First Purchase, Revenue, Subscription).
- At least one event is required to proceed.
- Results will include a separate incremental lift analysis for each selected event.
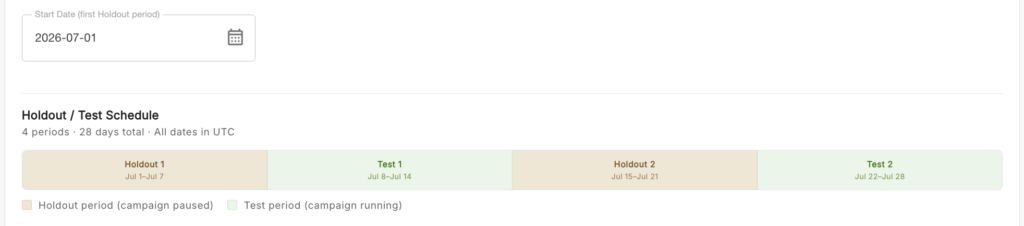
Step 3: Schedule Configuration (Pulse Testing)
Configure the ON/OFF schedule for your Pulse test.
How Pulse Testing Works
A Pulse test alternates between OFF periods — during which your campaign is manually paused at the ad network level — and ON periods, during which your campaign runs normally. By comparing conversion volumes during OFF and ON periods, the system calculates the true incremental lift attributable to your campaign spend.
Selecting a Start Date
Enter or select your desired test start date. The start date must be at least 1 day in the future to allow time for campaign coordination.
Once a start date is selected, the system automatically generates a default 4-period, 28-day schedule:
| Period | Type | Duration |
|---|---|---|
| Period 1 | OFF | 7 days |
| Period 2 | ON | 7 days |
| Period 3 | OFF | 7 days |
| Period 4 | ON | 7 days |
The schedule is displayed as a horizontal timeline visualization with bars representing OFF periods and bars representing ON periods. Each bar displays the period label, date range, and duration.
Editing the Schedule
Click Edit OFF Period on any period bar to modify that period’s date range. Note the following constraints:
- Completed OFF periods (periods with past end dates) cannot be edited.
- Changes that would create a negative ON period duration or cause periods to overlap will be blocked with a validation error.
- After any edit, the schedule is revalidated against all six business rules (see below).
Schedule Validation Rules
All schedules must pass the following six business rules before the test can be submitted:
| Rule | Requirement | Purpose |
|---|---|---|
| BR-1 | Minimum of 2 OFF periods | Ensures statistical validity |
| BR-2 | Total OFF days must be ≥ 14 | Minimum data collection threshold |
| BR-3 | Each OFF period must be 5–7 days in length | Captures consistent weekly usage patterns |
| BR-4 | Gap between OFF periods must be ≥ 7 days | Prevents data contamination between periods |
| BR-5 | The first 2 OFF periods must start on the same day of the week | Ensures consistent weekly pattern alignment |
| BR-6 | Additional OFF periods (3rd and beyond) have no day-of-week constraint | Provides flexibility for extended tests |
If any rule fails, a validation error will appear and the form cannot be submitted until it is resolved.
Step 4: Review & Submit
Review your complete test configuration, including the schedule timeline and all metadata, before submitting.
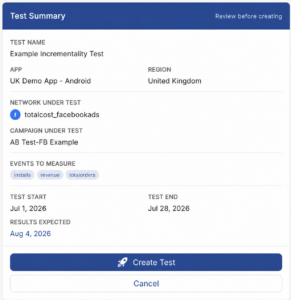
When ready, click Create Test.
- The system validates all fields and the schedule before submitting.
- Upon successful creation, you will be redirected to the Test Results page, which will display a Scheduled status.
- The auto-saved browser draft is cleared upon successful submission.
Understanding the Pulse Test Schedule
The Pulse method uses alternating ON and OFF periods as the system of record for your campaign’s activity signals. The Incrementality Tests module serves as a single pane of glass — a centralized system of record that replaces fragmented spreadsheet tracking for both the UA Manager (to confirm campaign pause) and the Strategist (to track the results timeline).
What you need to do during each period:
| Period Type | Your Action |
|---|---|
| OFF period starts | Log in to your ad network’s platform and pause the selected campaign. |
| ON period starts | Log in to your ad network’s platform and resume the selected campaign. |
Viewing Test Results
Click any test name in the test list to open its results page. The content displayed on the results page depends on the current test status.
Test Summary Card
The top section of the results page displays a summary card containing all test configuration details:
- Test Name, Network, Region, Campaign, App
- Test Duration (start and end dates)
- Current Status badge
- Estimated Results Date (displayed as a countdown for running and completed tests)
- Schedule timeline visualization with the current active period highlighted
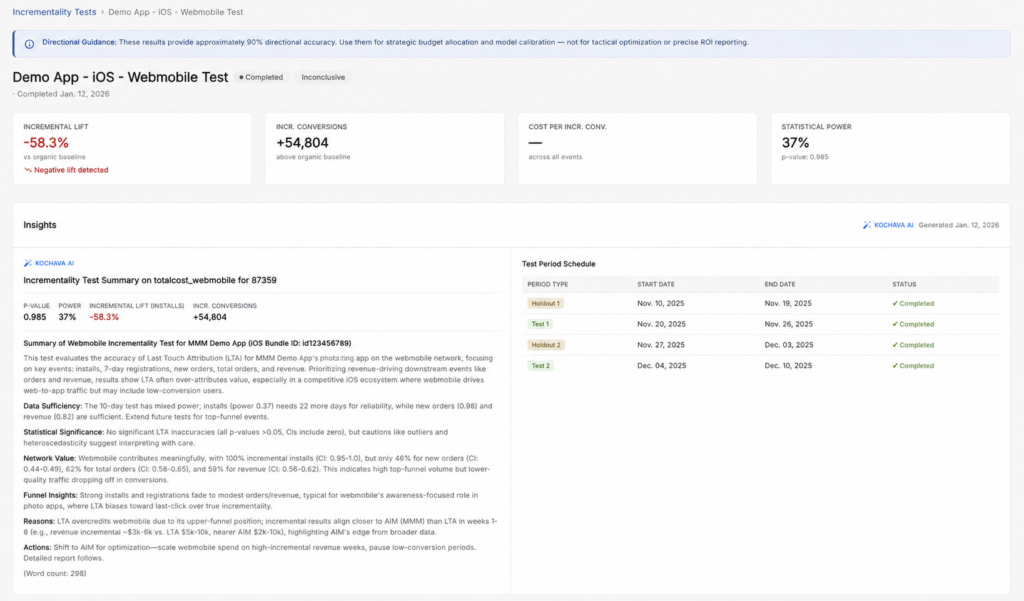
Statistical Confidence & AI Summary
Once results have been processed — available 7 calendar days after test completion — the following sections appear on the results page.
If results are still being processed after test completion, the page will display: “Results are being processed. This typically takes a few minutes.” The page auto-refreshes every 30 seconds until results are available.
Statistical Metrics Table
| Metric | Description | Quality Rating |
|---|---|---|
| p-value | The probability that the observed results occurred by chance. A value below 0.05 indicates statistical significance. | Good (< 0.05) / Poor (≥ 0.05) |
| Power | The test’s ability to detect a real effect if one exists. A value above 80% indicates sufficient sample size. | Good (> 80%) / Poor (≤ 80%) |
Test Conclusion
Based on the statistical metrics, the ML pipeline classifies each test with one of the following conclusions:
| Conclusion | Criteria | Badge Color |
|---|---|---|
| Conclusive – Statistically significant | p-value < 0.05 AND power > 80% | Green |
| Inconclusive – Insufficient statistical significance | p-value ≥ 0.05 | Yellow |
| Inconclusive – Insufficient sample size | Power ≤ 80% | Yellow |
If a test is inconclusive, a warning banner will appear explaining the reason and recommending corrective actions, such as running a longer test or selecting a higher-volume campaign.
AI-Generated Summary
An AI-generated summary is displayed for all completed tests in a Test Insights card. The summary includes:
- A plain-English summary of test performance (e.g., “Incremental lift of 25% detected”)
- An interpretation of statistical confidence (e.g., “Results are statistically significant with 85% power”)
- Recommendations for budget allocation
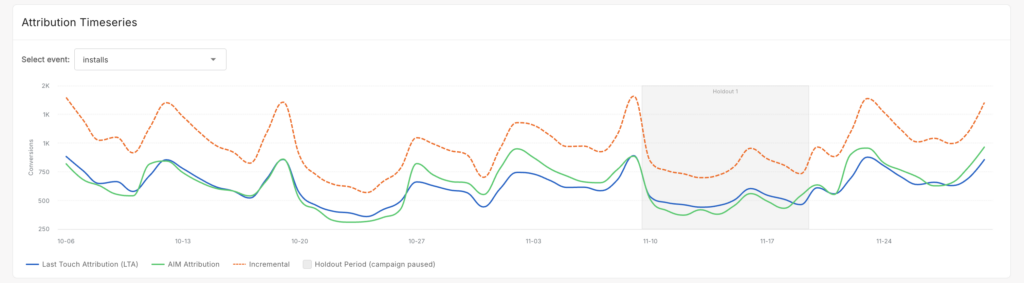
Incremental Lift Chart
A Highcharts timeseries visualization displays conversion data across the full test duration, with three attribution lines plotted simultaneously:
| Series | Color | Description |
|---|---|---|
| Last Touch (LTA) | Blue | Conversions attributed via Last Touch Attribution |
| AIM Attribution | Green | Conversions attributed via the AIM model |
| Incremental | Orange | True incremental conversions calculated by the ML pipeline |
- OFF periods are highlighted with gray vertical bands across the chart.
- ON periods have a white background.
- Interactive tooltips display the exact values for all three series on any given date when hovering over the chart.
- If the chart fails to load, a fallback message appears: “Chart visualization unavailable. View the data table below for metrics.”
Multi-Event Chart Navigation
If your test includes multiple events, an event dropdown selector appears above the chart. Select an event from the dropdown to update the chart and display data for that event. Only one event’s chart is displayed at a time.
[SCREENSHOT: Event dropdown selector above the chart with “First Purchase” selected from a list of multiple events]
The statistical metrics table always displays all selected events simultaneously for comparison — only the chart updates when you switch events.
Exporting the Chart: Use the Download PNG or Download SVG buttons to export the chart as an image file for use in presentations or reports.
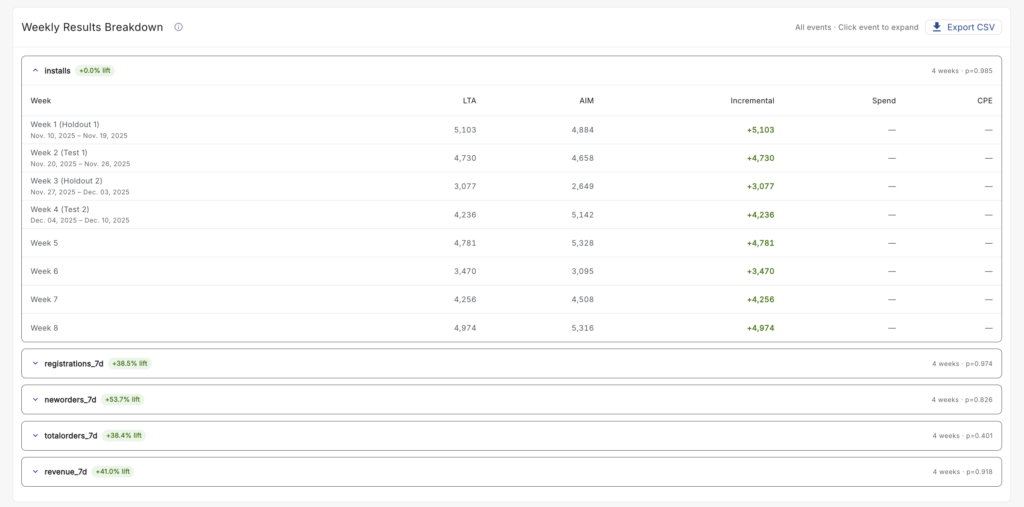
Key Metrics Table
A weekly breakdown table appears below the chart with the following columns:
| Column | Description |
|---|---|
| Week | The week number within the test |
| Test Group Conversions (LTA) | Last Touch Attribution conversions for the test group |
| Control Group Conversions | Baseline (organic) conversions |
| Incremental Lift (Absolute) | Test group conversions minus control group conversions |
| Incremental Lift (%) | Percentage lift over the baseline |
| Cost per Incremental Conversion | Total spend divided by incremental lift |
| Total Spend | Marketing spend for the period |
A totals row at the bottom of the table summarizes all weeks. The table is sortable by clicking any column header.
Special value handling:
- Zero or null metrics display as — (em dash). Hovering over the dash shows a tooltip explaining the reason (e.g., “No spend recorded during this period”).
- Negative lift values display in red with a warning icon. Negative lift indicates the campaign may have reduced conversions or cannibalized organic traffic — review campaign settings and test methodology if this occurs.
- Very large numbers are formatted for readability (e.g., $10.0M). Hover over any formatted value to see the full precision figure in a tooltip.
Partial Results During Running Tests
While a test is in Running status, a limited view of partial results may become available after the backend processing pipeline activates.
A prominent warning banner is displayed at the top of the page for all running tests:
“⚠️ Test in Progress — Results are Incomplete and Will Change. These are preliminary results for progress tracking only. Do not make strategic decisions based on partial data. Final results will be available 7 days after test completion.”
What is shown in partial results:
- Raw conversion counts for completed periods only
- Period progress indicator (e.g., “2 of 4 periods completed — 50%”)
- Spend validation warnings for any completed OFF periods where non-zero spend was detected
- Estimated completion date and results availability countdown
What is NOT shown in partial results:
- Statistical confidence metrics (p-value, power)
- Incremental lift calculations
- AI-generated summary
- Export CSV or Share Results options (these are disabled until the test completes)
Managing Tests
Pausing a Test
Running tests can be paused to temporarily stop data collection.
- From the test list or the test results page, click Pause Test.
- A confirmation dialog appears: “Are you sure? The test will stop collecting data until you resume it.”
- Click Confirm to pause the test.
- The test status changes to Paused and a Resume Test button replaces the Pause button.
Resuming a Test
Paused tests can be resumed at any time to continue data collection.
- On a paused test, click Resume Test.
- The test status returns to Running and data collection continues from where it left off.
Cancelling a Test
Running or paused tests can be permanently stopped.
- Click Cancel Test.
- A confirmation dialog appears: “Are you sure? This will stop the test permanently and cannot be undone.”
- Click Confirm to cancel the test.
- The test status changes to Cancelled. Any partial results collected up to the point of cancellation remain viewable, but no further data is collected and the test cannot be resumed.
Deleting a Test
Tests that are not currently in Running status can be deleted.
- Click the Delete icon (trash icon) in the Actions column for the test you want to delete.
- A confirmation dialog appears: “Are you sure you want to delete this test? This action cannot be undone.”
- Click Confirm to delete the test.
Valid actions by status:
| Current Status | Available Actions |
|---|---|
| Scheduled | Cancel, Delete |
| Running | Pause, Cancel |
| Paused | Resume, Cancel, Delete |
| Completed | Delete |
| Cancelled | Delete |
| Incomplete | Delete |
Exporting Results to CSV
From the test results page for a completed test, click Export CSV to download a CSV file of your results.
The export includes:
- Test metadata (name, network, region, campaigns, events, duration, status, conclusion)
- Statistical metrics (p-value, power)
- Weekly conversion metrics (test group conversions, control group conversions, incremental lift, incremental lift %, cost per incremental conversion, total spend)
File naming convention: incrementality-test-{testId}-{date}.csv
The CSV uses UTF-8 encoding with BOM for Excel compatibility. A disclaimer row is included at the top of the file: “These results provide directional guidance (90% accuracy). Use for strategic decisions, not tactical optimization.”
You can also export a filtered list of tests from the test list page using the Export CSV button in the filter bar. Test list exports are limited to 1,000 rows. If your filtered list exceeds 1,000 tests, you will be prompted to refine your filters before exporting.
Test Limits & Validation Reference
| Limit or Rule | Value |
|---|---|
| Test name length | 1–255 characters |
| Test name uniqueness | Must be unique per advertiser account (case-sensitive; leading/trailing whitespace is trimmed) |
| App selection | Exactly 1 app per test |
| Campaign selection | Exactly 1 campaign per test |
| Event selection | 1–20 events per test |
| Test duration | 14–90 days total |
| Test start date | Must be at least 1 day in the future |
| Minimum OFF periods | 2 |
| Total OFF days | ≥ 14 days |
| Each OFF period length | 5–7 days |
| Gap between OFF periods | ≥ 7 days |
| Day-of-week alignment | First 2 OFF periods must start on the same day of the week |
| Overlapping tests | Only one active or scheduled test per campaign at a time |
| Results availability | 7 calendar days after the test end date at 00:00 UTC |
| Admin access required | Yes — non-admin users cannot create or manage tests |
Frequently Asked Questions
Q: Why can’t I select more than one app for my test?
Incrementality tests are scoped to exactly one app per test. Even if your platform context includes multiple apps selected globally, the App field on the Create Test form is always a single-select dropdown. The system does not pre-populate or inherit your multi-app selection. You must explicitly choose one app per test.
Q: When will my test results be available?
Results are available 7 calendar days after the test end date at 00:00 UTC. The ML pipeline runs daily at 02:00 UTC and processes all tests that have met this threshold. The estimated results date is displayed on the test results page alongside a countdown timer. If results are still processing after the estimated date, the page will auto-refresh every 30 seconds until results are populated.
Q: My test shows “Inconclusive.” What should I do?
An inconclusive result means the test did not achieve statistical significance (p-value ≥ 0.05) or did not have sufficient sample size (power ≤ 80%). This means the observed results may be due to chance rather than a real marketing effect. The AI-generated summary will explain the specific reason and provide recommendations. Common corrective actions include:
- Running a longer test (more OFF periods or longer OFF periods)
- Selecting a higher-volume campaign with more daily conversions
- Ensuring the campaign was fully paused during all OFF periods
Q: What does a spend warning mean on my results page?
A spend warning means non-zero spend was detected during one of your OFF periods, indicating the campaign may not have been fully paused at the network level. This can compromise the scientific validity of your results. Always manually verify that your campaign is fully paused in your ad network’s platform at the start of each OFF period before the period begins.
Q: Can I run two tests on the same campaign at the same time?
No. Only one active or scheduled test per campaign is allowed at a time. Overlapping tests on the same campaign would contaminate results and invalidate the statistical analysis. If you attempt to create a new test for a campaign that already has an active test, you will see a validation error. You must either select a different campaign, wait until the existing test completes, or cancel the existing test first.
Q: What does “Incomplete” status mean?
Incomplete status typically indicates that the campaign associated with the test was deleted or archived from the ad network before or during the test. The system stores a snapshot of campaign data at test creation time, so historical results are preserved and displayed with a warning banner indicating the campaign is no longer active. Results may be partial depending on when the campaign was deleted relative to the test schedule.
Q: How should I use these results strategically?
Incrementality test results provide 90% directional guidance to calibrate your AIM MMM model and validate your marketing investment. Use them to:
- Validate or recalibrate your AIM model’s Incrementality Factor
- Provide scientific justification for budget decisions to CFOs and leadership
- Identify channels where Last Touch Attribution may be overstating or understating performance
- Make directional budget allocation decisions based on true causal lift
Results should not be used as precise numbers for day-to-day tactical bid management or campaign optimization. For final tactical nuance, use Last Touch Attribution (LTA) in combination with your incrementality results.
Q: Does Kochava automatically pause my campaigns during OFF periods?
No. The Incrementality Tests module does not integrate with ad network platforms to automatically pause or resume campaigns. You are responsible for manually pausing the selected campaign in your ad network’s platform at the start of each OFF period and resuming it at the start of each ON period. The schedule timeline on the test results page serves as your reference for when each period begins and ends.
Related Articles