This feature is available only with paid Kochava accounts. Contact us to learn more.
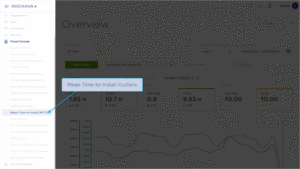
The Fraud Console Mean-Time-to-Install Outliers page provides a detailed view of the number of installs that fall outside the average time between click and install.
Fraud Console User Interface
- Log in to Kochava.
- Select the desired Account.
- Select Fraud Console > Mean-Time-to-Install (MTTI) Outliers.
MTTI Outlier Options Menu
The data displayed on the MTTI Outlier page can be organized by a set number of days back, App Name – ID or Network Name – ID. The following options are available:
Days Back:
- 30
- 7
App Name – ID:
- Select All
- Specific App (Client Dependent)
Network Name – ID:
- Select All
- Specific Network (Client Dependent)
Once selections have been made within the options menu you must click Apply in order to update the graphs and charts within the page.
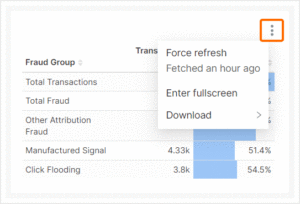
Graph/Chart Tools Menu
Each graph and chart provides a tools menu allowing you to force a refresh, enter fullscreen, or download the associated data in multiple forms.
Force Refresh:
This option provides the ability to retrieve the latest data for the corresponding graph/chart. Once the tool menu has been clicked, a timeframe will be displayed listing the last time the data was fetched. Clicking Force Refresh will only update the associated graph/chart.
Enter Full Screen:
This option provides the ability to increase the size of the graph/chart to display in the entire screen. While in full screen mode, an option is provided to return to the summary page.
Download:
This option provides the ability to download the graph/chart in the following formats:
- Export to .CSV
- Export to Excel
- Download as Image
Overview Section
The Overview Section provides the total outlier installs and the percentage of all installs that the outliers represent.
App Totals
The App Totals table displays the apps with the highest amount of installs along with the total number of outlier installs as well as the percentage of the total installs that the outlier installs represents. The data within the table can be organized by App Name – ID, Outlier Installs, Total Install Count and % Total Installs.
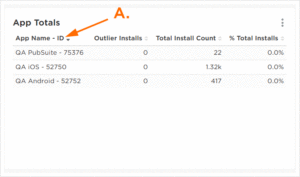
A. Organize data by desired column.
Network Totals
The Network Totals table displays the networks with the highest amount of installs along with the total number of outlier installs as well as the percentage of the total installs that the outlier installs represents. The data within the table can be organized by Network Name – ID, Outlier Installs, Total Install Count and % Total Installs.
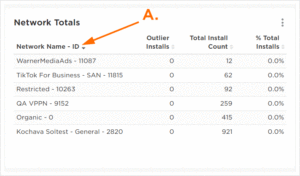
A. Organize data by desired column.
Fraud – MTTI – MTTI Diff
The MTTI to MTTI differential graph provides the ability to compare the Average Non Outlier MTTI to the Average Outlier MTTI.
Mousing over the graph will display the corresponding network data.
The graph also provides the ability to toggle on or off either of the metrics.
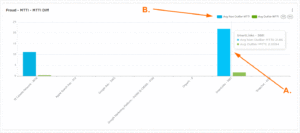
A. Mouse over the graph to view the corresponding data.
B. Metrics can be toggled on or off.
MTTI Outlier Table
The MTTI Outlier Table provides row level data detailing the network MTTI Variances by App Name. The table can be organized by App Name – ID, Network Name – ID, Site ID, MTTI (Hours), Network Mean MTTI (Hours), MTTI Variance and Install Count.
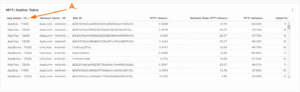
A. Organize data by desired column.