This feature is available only with paid Kochava accounts. Contact us to learn more.
The Measurement Explorer provides a powerful visualization tool for in-depth analysis of partner spend data, combined with Kochava measurement data, to explore your media spend and resulting performance of installs and post-install event activity through the use of various pre-built views and selectable fields.
Requirement Measurement Key / Value Pair
We highly recommend checking your Kochava tracking links to ensure that the below keys are included exactly as below. This is necessary for us to join your Cost data to Measurement data.
- partner_campaign_id = the network partner’s campaign ID.
- partner_campaign_name = not required, but is human-readable and useful to have on measurement data.
- creative_Id = required for joining cost to measurement data at the creative level – EITHER the creative_id or creative_name can be passed here, so long as it is available from the network in cost data to join – AND doesn’t change mid-campaign.
Example: partner_campaign_id={partner macro here}
Example: Your links could contain both —
control.kochava.com/v1/cpi/click?campaign_id=12345&cp_2={partner_campaign_id}&partner_campaign_id={partner_campaign_id}
Lifetime Value (LTV) Calculations:
Lifetime Value (LTV) calculations vary in terms of how they are calculated across industries and advertisers. To solve for this, we have created a standard event called “LTV” that can be sent to Kochava at any interval that makes sense for the advertiser. Include the LTV value in the event_data section. (e.g., event_name -> “LTV” and event_value -> “$4.56”).
Our Measurement Explorer will look for an event called “LTV” and collect the last value sent and display the event_value as sent on the event. This allows our system to display the sum of user LTV across available dimensions for the most recent value received.
When the Cost Measurement Explorer view is loaded, the user is provided with the option of clicking on seven pre-built views:
- Post-Install Analysis Cost — Enables the viewing of cost-reported traffic, conversions, and (measurement) post-install event data split by network name and campaign name.
- Post-Install Analysis Measurement — Enables the viewing of measurement-reported traffic, conversions and post-install event data split by network name and campaign name.
- ROAS by App — Enables the viewing of Return on Ad Spend and send split by app name.
- ROAS by Company Name — Enables the viewing of Return on Ad Spend and send split by company name.
- ROAS by Campaign — Enables the viewing of Return on Ad Spend and send split by company and campaign name.
- ROAS by Country — Enables the viewing of Return on Ad Spend and send split by country.
- ROAS by Creative — Enables the viewing of Return on Ad Spend and send split by country and creative.
The Cost Measurement Explorer is divided into two main sections:
The top section provides the ability to filter by date range and currency.
The second and main section of the page provides the ability to switch between the pre-built views and examine the associated data.
Cost Measurement Explorer Interface
- Log in to Kochava.
- Select the desired Account.
- Select Cost > Measurement Explorer.
Using Filters
Time Range:
The date range filter provides the option to refine the window of data that is displayed. The following range types and time ranges are available for selection:
- Last:
- last day
- last week
- last month
- last quarter
- last year
- Previous:
- previous calendar week
- precious calendar month
- previous calendar year
- Custom:
- Start (Inclusive):
- Relative Date/Time — This option provides a text field in which a number can be manually entered and a drop-down box where the following options:
- Days Before
- Seconds Before
- Minutes Before
- Hours Before
- Weeks Before
- Months Before
- Quarters Before
- Years Before
- Specific Date/Time — A manual date/time may be entered or the calendar and time selection tool may be used.
- Now — This is the selection of the current date and time.
- Midnight — This is the selection of the current date and the time selection of midnight or (24:00hrs).
- Relative Date/Time — This option provides a text field in which a number can be manually entered and a drop-down box where the following options:
- End (Exclusive):
- Specific Date/Time — A manual date/time may be entered or the calendar and time selection tool may be used.
- Relative Date/Time — This option provides a text field in which a number can be manually entered and a drop-down box where the following options:
- Days After
- Seconds After
- Minutes After
- Hours After
- Weeks After
- Months After
- Quarters After
- Years After
- Now — This is the selection of the current date and time.
- Midnight — This is the selection of the current date and the time selection of midnight or (24:00hrs).
- Start (Inclusive):
- Advanced:
- Start (Inclusive) — Manually enter today or a specific desired start date.
- End (Exclusive) — Manually enter today or a specific desired end date.
- Previous:
- previous calendar week
- previous calendar month
- previous calendar year
- No filter:
A. After range selection, select the desired time range.
B. Time range that will be displayed.
Currency:
By default cost data is displayed in US Dollars, however cost data may be displayed in a variety of other currency.
From the Currency drop-down menu select one of the following:
- AED
- AFN
- ALL
- AMD
- ANG
- AOA
- ARS
- AUD
- AWG
- AZN
- BAM
- BBD
- BDT
- BGN
- BHD
- BIF
- BMD
- BND
- BOB
- BRL
- BSD
- BTC
- BTN
- BWP
- BYN
- BYR
- BZD
- CAD
- CDF
- CHF
- CLF
- CLP
- CNH
- CNY
- COP
- CRC
- CUC
- CUP
- CVE
- CZK
- DJF
- DKK
- DOP
- DZD
- EEK
- EGP
- ERN
- ETB
- EUR
- FJD
- FKP
- GBP
- GEL
- GGP
- GHS
- GIP
- GMD
- GNF
- GTQ
- GYD
- HKD
- HNL
- HRK
- HTG
- HUF
- IDR
- ILS
- IMP
- INR
- IQD
- IRR
- ISK
- JEP
- JMD
- JOD
- JPY
- KES
- KGS
- KHR
- KMF
- KPW
- KRW
- KWD
- KYD
- KZT
- LAK
- LBP
- LKR
- LRD
- LSL
- LYD
- MAD
- MDL
- MGA
- MKD
- MMK
- MNT
- MOP
- MRU
- MVR
- MWK
- MXN
- MYR
- MZN
- NAD
- NGN
- NIO
- NOK
- NPR
- NZD
- OMR
- PAB
- PEN
- PGK
- PHP
- PKR
- PLN
- PYG
- QAR
- RON
- RSD
- RUB
- RWF
- SAR
- SBD
- SCR
- SDG
- SEK
- SGD
- SHP
- SLL
- SOS
- SRD
- SSP
- STD
- STN
- SVC
- SYP
- SZL
- THB
- TJS
- TMT
- TND
- TOP
- TRY
- TTD
- TWD
- TZS
- UAH
- UGX
- USD
- UYU
- UZS
- VES
- VND
- VUV
- WST
- XAF
- XAG
- XAU
- XCD
- XDR
- XOF
- XPD
- XPF
- XPT
- YER
- ZAR
- ZMW
- ZWL
After filters have been selected, you must click Apply Filters before the graphic displays or row level data will be updated.
Graph/Chart Tools Menu
Each graph and chart provides a tools menu allowing you to force a refresh, enter fullscreen, or download the associated data in multiple forms.
Force Refresh:
This option provides the ability to retrieve the latest data for the corresponding graph/chart. Once the tool menu has been clicked, a timeframe will be displayed listing the last time the data was fetched. Clicking Force Refresh will only update the associated graph/chart.
Enter Full Screen:
This option provides the ability to increase the size of the graph/chart to display in the entire screen. While in full screen mode, an option is provided to return to the summary page.
Download:
This option provides the ability to download the graph/chart in the following formats:
- Export to .CSV
- Export to Excell
- Download as Image
Measurement Explorer Graphs
The Measurement Explorer Graphs provide the ability to deep dive into the data for post-install costs, post-install measurement as well as ROAS by app; campaign name; country and creative through the use of interactive graphs and row level data tables.
Post-Install Analysis Cost:
The Post-Install Analysis Cost table displays row level data for the measurement by:
- company_network_name
- partner_campaign_names
- Cost Impressions
- Cost Clicks
- cost_ctr
- Cost Installs
- cost_conversion_rate
- retention
- Measurement Revenue Event
- Revenue
- Spend
- ROAS
Each column can be sorted in order to display data as needed.
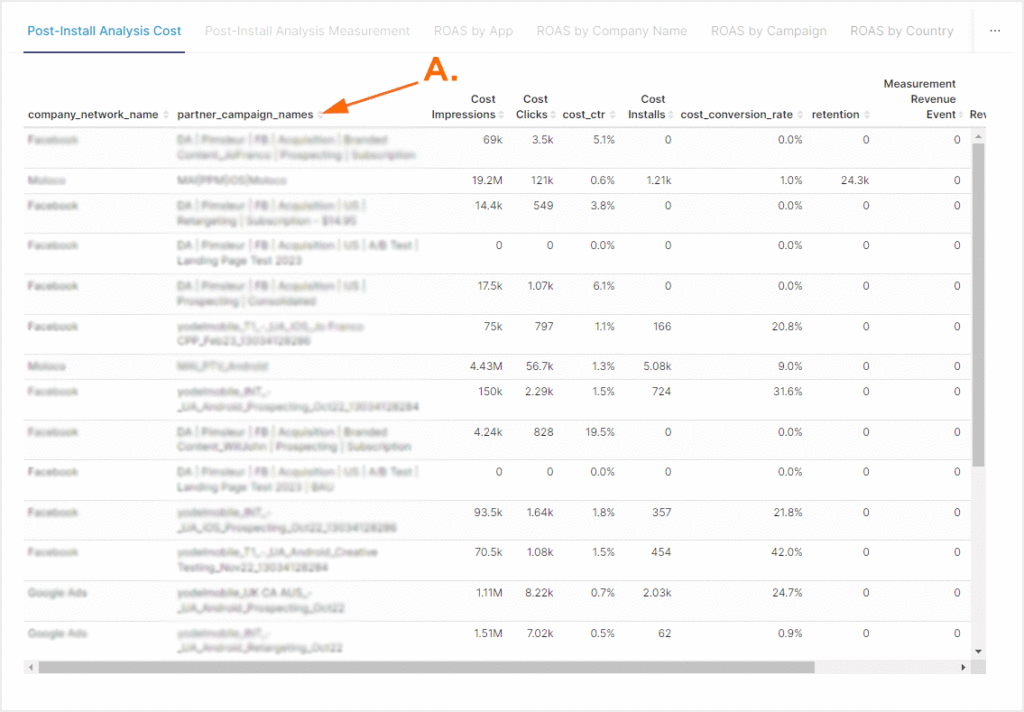
A. Each column can be sorted to customize the display of data.
Post-Install Analysis Measurement:
The Post-Install Analysis Measurement table displays row level data for the measurement by:
- company_network_name
- partner_campaign_names
- Measurement Impressions
- Measurement Clicks
- measurement_ctr
- Measurement Installs
- measurement_conversion
- retention
- Measurement Revenue Event
- Revenue
- Spend
- ROAS
Each column can be sorted in order to display data as needed.
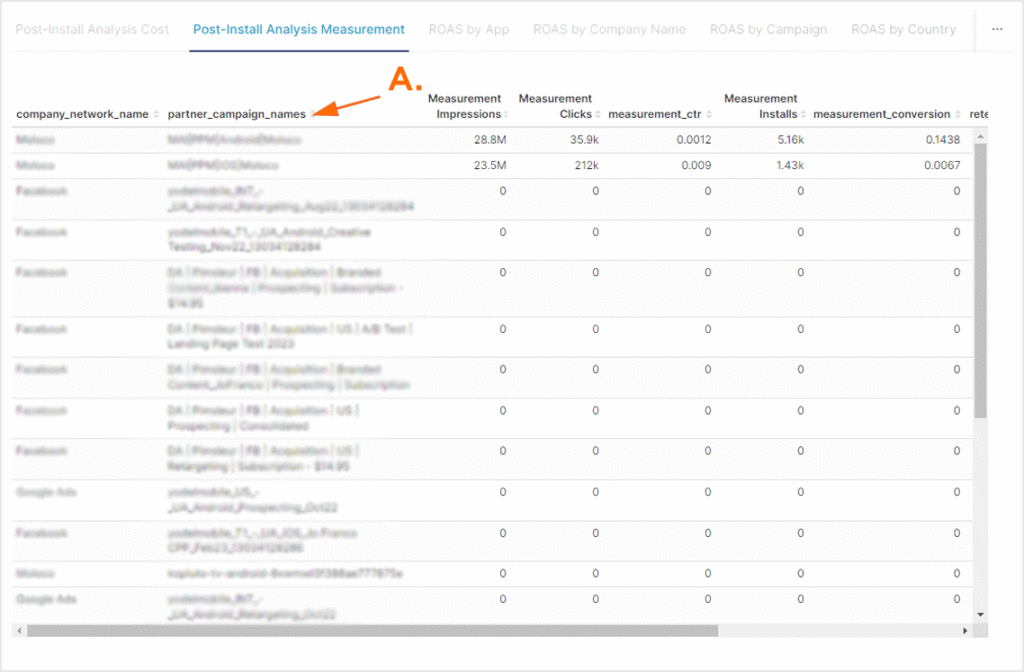
A. Each column can be sorted to customize the display of data.
ROAS by App:
The ROAS (Return on Ad Spend) by App section provides a graphic display of the revenue, spend and ROAS displayed by app for the selected time frame. Each metric is represented with a specific color on the graph and clicking on the metric title enables or disables the data associated with that metric. The vertical axis of the graph represents the selected currency and the horizontal axis represents the available apps.
Mousing over an app will display the partner data for that app for each of the enabled metrics.
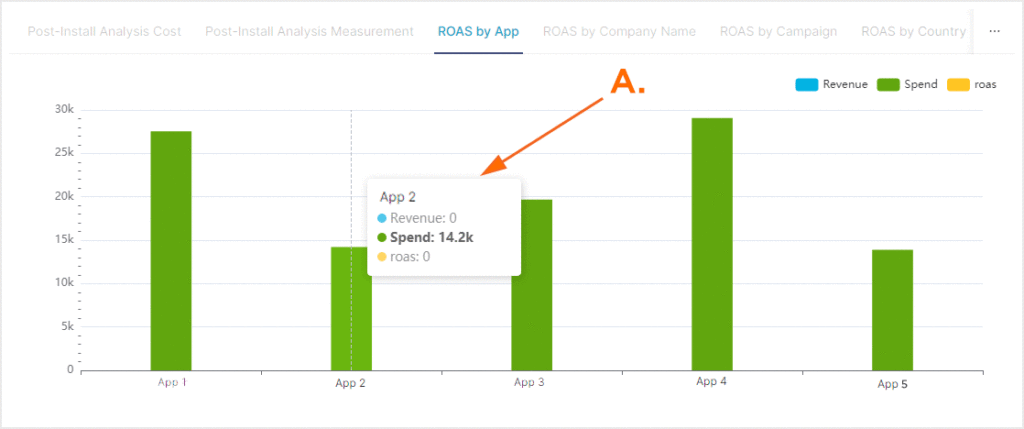
A. Mouse over column to view associated data.
ROAS by App Table:
The ROAS by App section also provides a row level table displaying the app name(s), revenue, spend and ROAS. Each column can be sorted in order to display data as needed.

A. Each column can be sorted to customize the display of data.
ROAS by Campaign Name:
The ROAS (Return on Ad Spend) by Company Name section provides a graphic display of the revenue, spend and ROAS displayed by company for the selected time frame. Each metric is represented with a specific color on the graph and clicking on the metric title enables or disables the data associated with that metric. The vertical axis of the graph represents the selected currency and the horizontal axis represents the available apps.
Mousing over an app will display the partner data for that company for each of the enabled metrics.
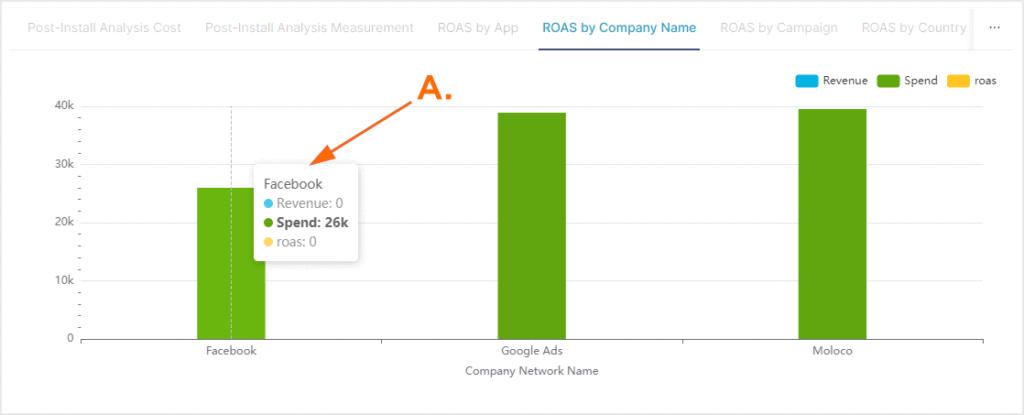
A. Mouse over column to view associated data.
ROAS by Company Table:
The ROAS by Company section also provides a row level table displaying the company name, revenue, spend and ROAS. Each column can be sorted in order to display data as needed.
ROAS by Campaign:
The ROAS (Return on Ad Spend) by Campaign Name section provides a graphic display of the revenue, spend and ROAS displayed by campaign for the selected time frame. Each metric is represented with a specific color on the graph and clicking on the metric title enables or disables the data associated with that metric. The vertical axis of the graph represents the selected currency and the horizontal axis represents the available campaigns.
Mousing over a campaign will display the partner data for that company for each of the enabled metrics.
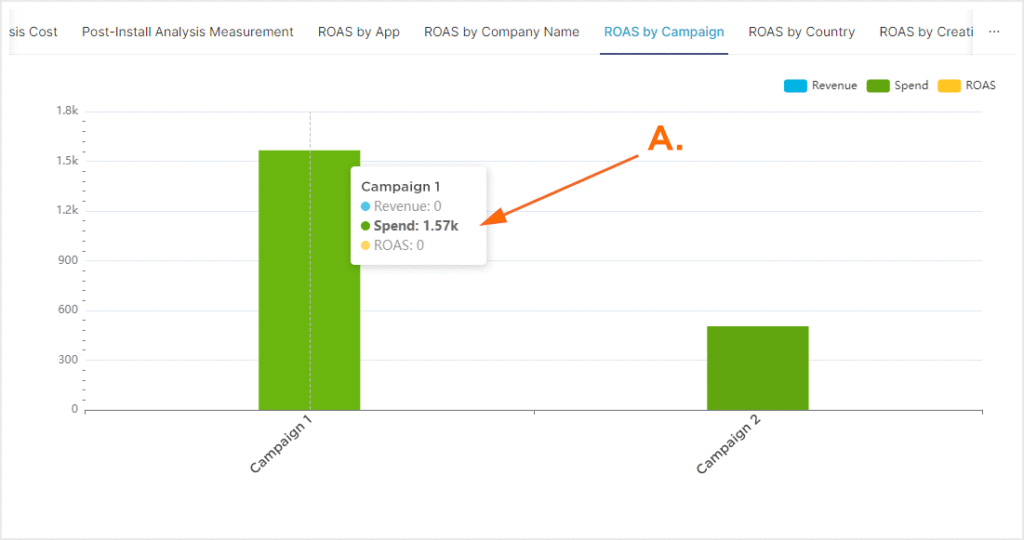
A. Mouse over column to view associated data.
ROAS by Campaign Table:
The ROAS by Campaign section also provides a row level table displaying the campaign name and spend. Each column can be sorted in order to display data as needed.
ROAS by Country:
The ROAS (Return on Ad Spend) by Country section provides three world maps displaying revenue, spend and ROAS. Each world map is color coded to represent the specific metric and mousing over a country will display the partner data for that company for each of the enabled metrics.
ROAS by Country Table:
The ROAS by Country section also provides a row level table displaying the company network name, country, revenue, spend and ROAS. Each column can be sorted in order to display data as needed.
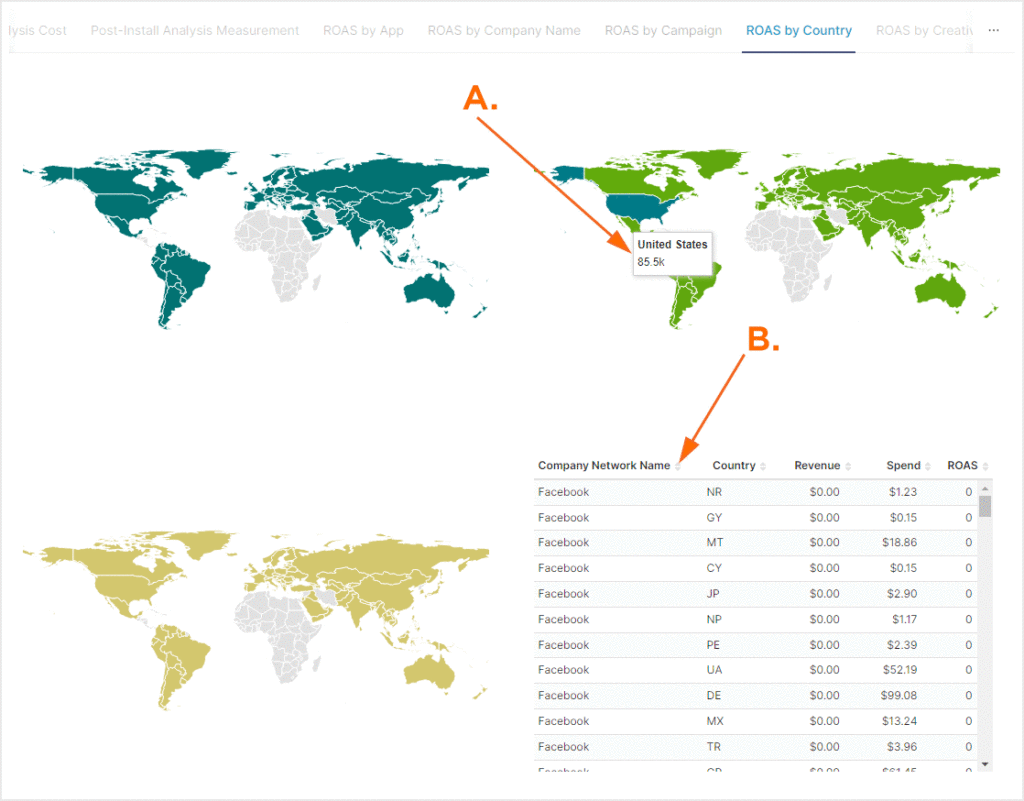
A. Mouse over country to view associated data.
B. Each column can be sorted to customize the display of data.
ROAS by Creative:
The ROAS (Return on Ad Spend) by Creative Name section provides a graphic display of the revenue, spend and ROAS displayed by creative name for the selected time frame. Each metric is represented with a specific color on the graph and clicking on the metric title enables or disables the data associated with that metric. The vertical axis of the graph represents the selected currency and the horizontal axis represents the available apps.
Mousing over an creative will display the partner data for that creative for each of the enabled metrics.
ROAS by Creative Table:
The ROAS by Company section also provides a row level table displaying the company name, revenue, spend and ROAS. Each column can be sorted in order to display data as needed.
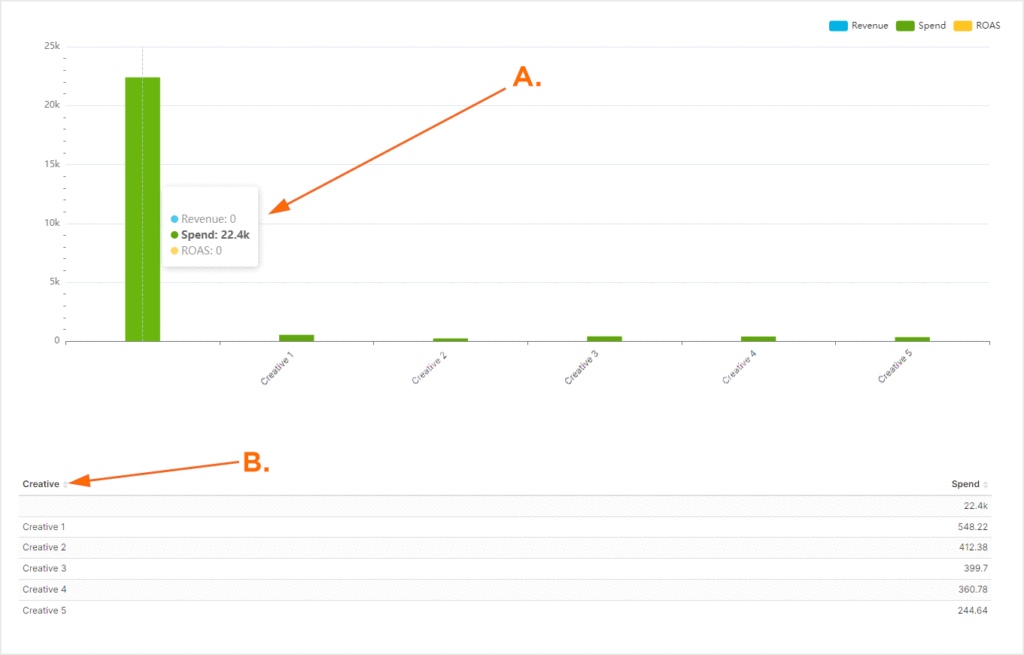
A. Mouse over column to view associated data.
B. Each column can be sorted to customize the display of data.
