Understanding Identity Linking —
IdentityLink™ provides the opportunity to link different devices together by associating an internal customer identifier with a Kochava device ID. Think of Identity Link as a one-to-many model where a single unique internal ID can be tied to many Associated Identifiers providing a more full and clearer picture of a user. This is useful when trying to tie users across multiple devices based on a internal identifier, for example mobile and desktop users.
The page is divided into two main sections:
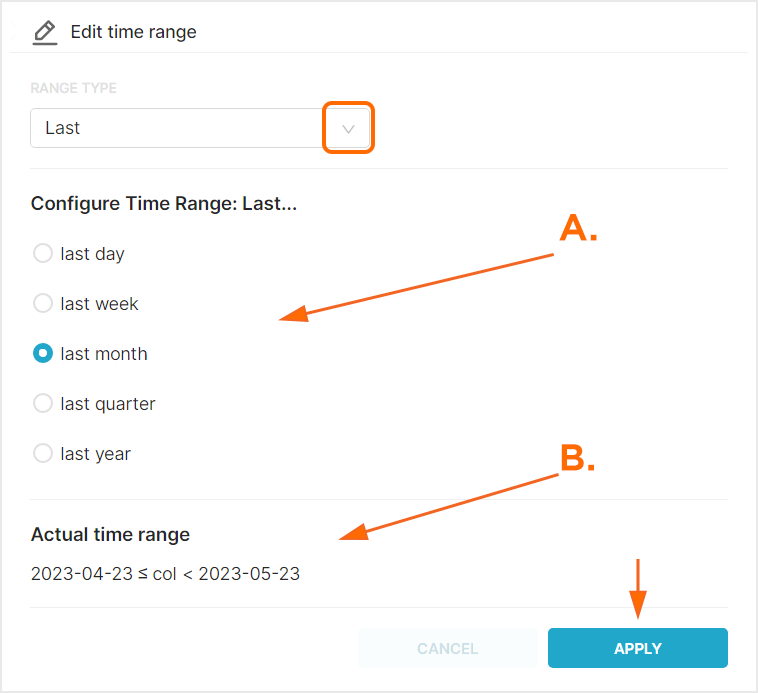
The left section provides the ability to filter by date range.
The second and main section of the page provides the interactive graphs and mousing over the interactive graph displays the corresponding data.
Identity Locker Insights User Interface:
- Log in to Kochava.
- Select the desired Account and App.
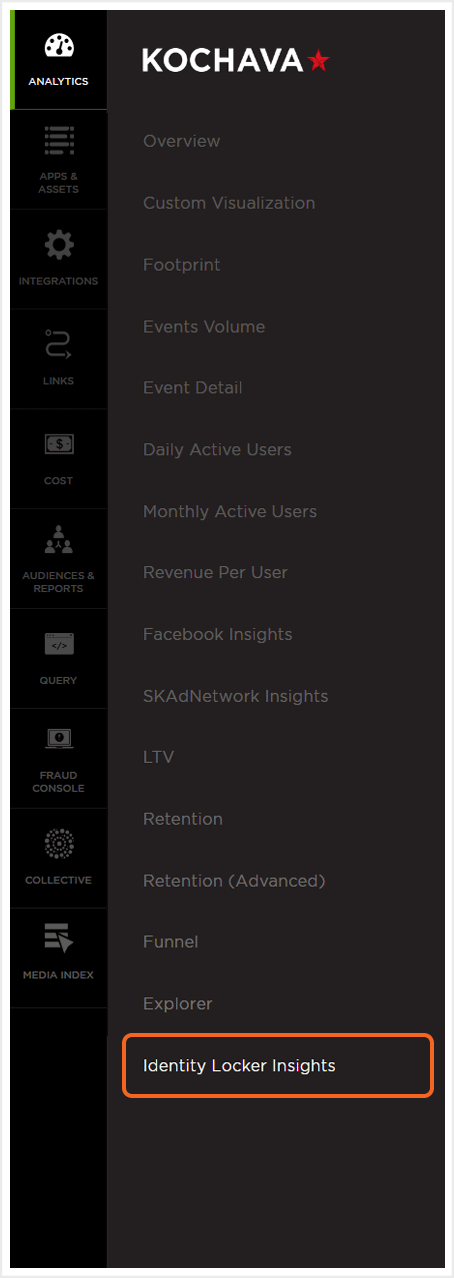
- Select Analytics > Identity Locker Insights.

Using Filters
The date range filter provides the option to refine the window of data that is displayed. The following range types and time ranges are available for selection:
- Last:
- last day
- last week
- last month
- last quarter
- last year
- Previous:
- previous calendar week
- precious calendar month
- previous calendar year
- Custom:
- Start (Inclusive):
- Relative Date/Time — This option provides a text field in which a number can be manually entered and a drop-down box where the following options:
- Days Before
- Seconds Before
- Minutes Before
- Hours Before
- Weeks Before
- Months Before
- Quarters Before
- Years Before
- Specific Date/Time — A manual date/time may be entered or the calendar and time selection tool may be used.
- Now — This is the selection of the current date and time.
- Midnight — This is the selection of the current date and the time selection of midnight or (24:00hrs).
- Relative Date/Time — This option provides a text field in which a number can be manually entered and a drop-down box where the following options:
- End (Exclusive):
- Specific Date/Time — A manual date/time may be entered or the calendar and time selection tool may be used.
- Relative Date/Time — This option provides a text field in which a number can be manually entered and a drop-down box where the following options:
- Days After
- Seconds After
- Minutes After
- Hours After
- Weeks After
- Months After
- Quarters After
- Years After
- Now — This is the selection of the current date and time.
- Midnight — This is the selection of the current date and the time selection of midnight or (24:00hrs).
- Start (Inclusive):
- Advanced:
- Start (Inclusive) — Manually enter today or a specific desired start date.
- End (Exclusive) — Manually enter today or a specific desired end date.
- Previous:
- previous calendar week
- previous calendar month
- previous calendar year
- No filter:

B. Time range that will be displayed.
After filters have been selected, you must click Apply Filters before the graphic displays or row level data will be updated.
Interactive Charts
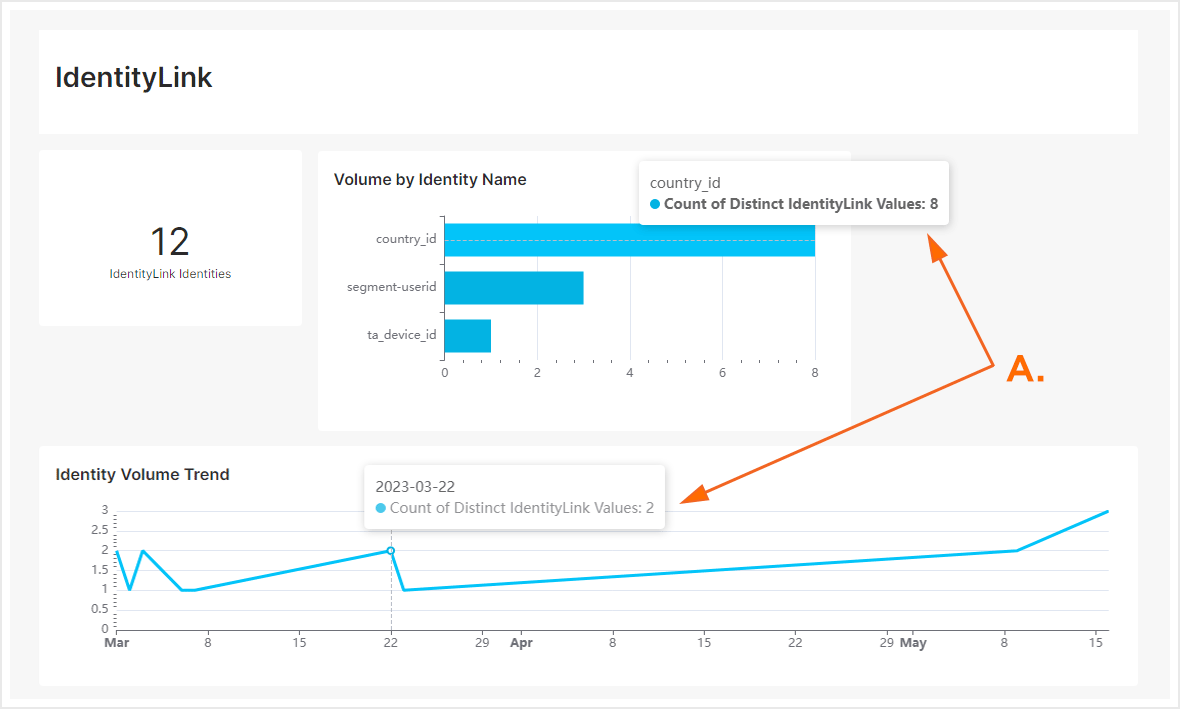
- The IdentityLink™ section provides visual display of the number of IdentityLink™ Identities, a graph of the Volume by Identity Name and a graph of the Identity Volume Trend. The graphs provides a interactive mouseover feature providing the ability to view the data at any specific point within the graph.
IdentityLink™ Identities
This section provides the number of unique identities within IdentityLink™.
Volume by Identity
This graph displays the volume of custom_id, app_userid and email identifications that are present within the IdentityLink™ Identities.
Identity Volume Trend
This graph displays the volume of each identity over the selected timeframe.

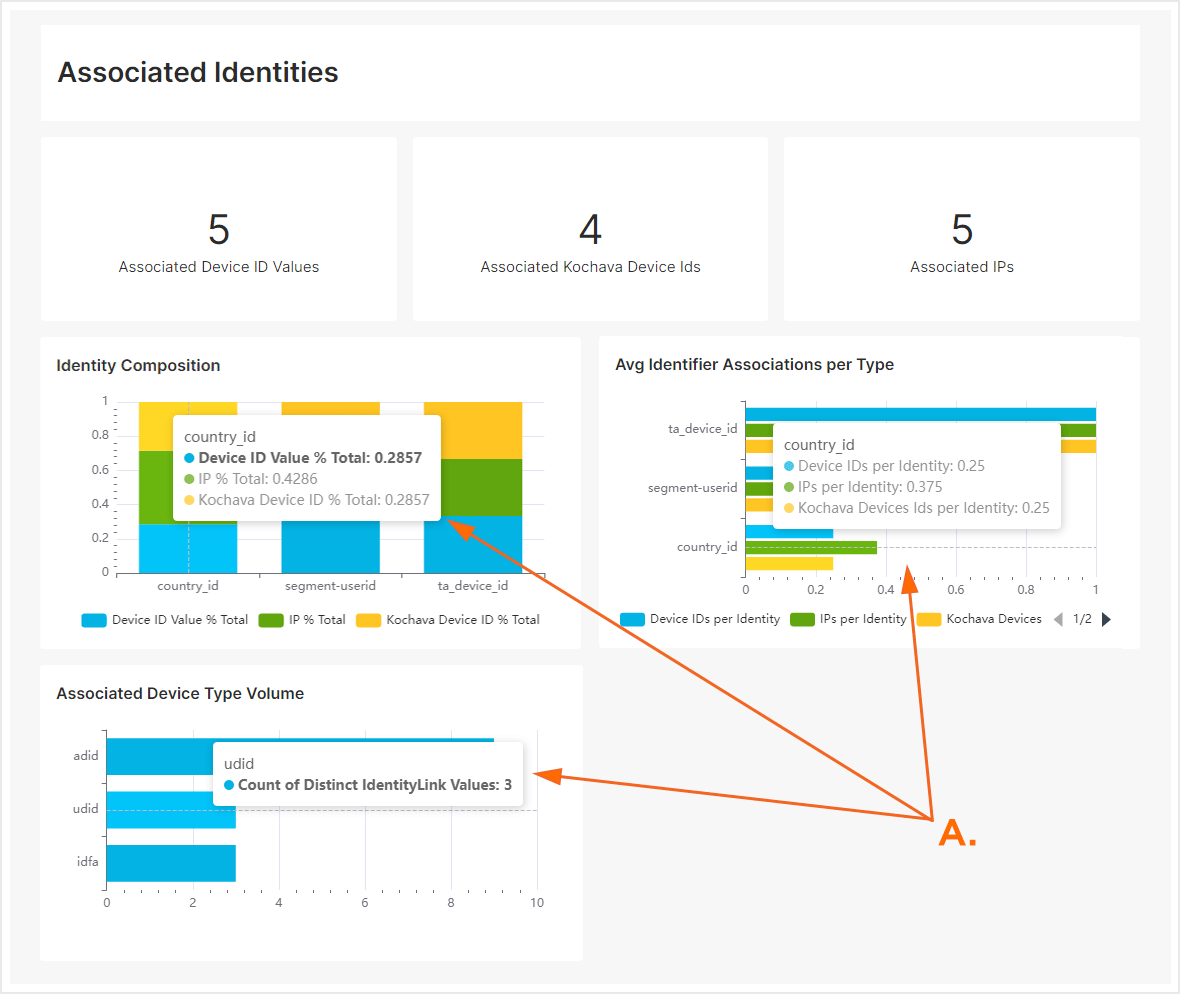
A. Mouse over graphs to view associated metric data. - The Associated Identifiers section provides visual display of the number of Associated Device Id Values, Associated Kochava Device IDs, Associated IPs, as well as graphs/charts of the Identity Composition, Average Identifier Associations per Identity and Associated Device Type Volume. The graphs provides a interactive mouseover feature providing the ability to view the data at any specific point within the graph.
Associated Device ID Values
This section provides the number of unique Device IDs that have been associated to an IdentityLink™.
Associated Kochava Device ID Values
This section provides the number of unique Kochava Device IDs that have been associated to an IdentityLink™.
Associated IPs Values
This section provides the number of unique IP Addresses that have been associated to an IdentityLink™.
Identity Composition
This graph displays the composition of custom_id, app_userid and email within a donut chart. Each of the ID types are color coordinated and can be enabled/disabled by clicking on the ID title in the lower section of the graph. Mousing over any of the sections of the donut chart will display the associated data.
Average Identifier Associations per Identity
This graph displays the average composition of app_userid, custom_id and email per Identity. Each of the ID types are color coordinated and can be enabled/disabled by clicking on the ID title in the lower section of the graph. Mousing over any of the sections of the graph will display the associated data.
Associated Device Type Volume
This graph displays the volume of associated device ID types. The vertical axis of the graph displays the ID type and the horizontal axis displays the identity count. Mousing over any of the sections of the graph will display the associated data.

A. Mouse over graphs to view associated metric data.


