This feature is available only with paid Kochava accounts. Contact us to learn more.
The SKAdNetwork Explorer provides a powerful visualization tool for in-depth analysis of partner spend data through the use of various pre-built views.
When the SKAdNetwork Explorer view is first loaded, the user is provided with the option of clicking on four Quick Start options to quickly jump into the data:
- SKAdNetwork Install Match Type — Enables the viewing of installs and spend by SKAdNetwork Match Type.
- SKAdNetwork Reinstall Percentage — Enables the viewing of SKAdNetwork reinstalls and spend.
- Cost vs. SKAdNetwork Review — Enables the viewing of cost-collected data alongside SKAdNetwork data.
- SKAdNetwork Influencer Review — Enables the viewing of click and impression influencers alongside SKAdNetwork install data and spend.
The page is divided into two main sections:
The top section provides the ability to filter by date range and currency.
The second and main section of the page provides the interactive graphs and row level data display. Mousing over the interactive graph displays the corresponding data, and the row level data may be organized by any of the columns.
SKAdNetwork Explorer User Interface
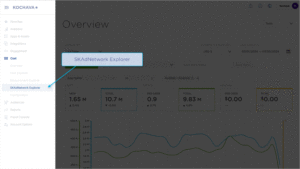
- Log in to Kochava.
- Select the desired Account.
- Select Cost > SKAdNetwork Explorer.
Using Filters
Date Range:
The date range filter provides the option to refine the window of data that is displayed. The following range types and time ranges are available for selection:
- Last:
- last day
- last week
- last month
- last quarter
- last year
- Previous:
- previous calendar week
- precious calendar month
- previous calendar year
- Custom:
- Start (Inclusive):
- Relative Date/Time — This option provides a text field in which a number can be manually entered and a drop-down box where the following options:
- Days Before
- Seconds Before
- Minutes Before
- Hours Before
- Weeks Before
- Months Before
- Quarters Before
- Years Before
- Specific Date/Time — A manual date/time may be entered or the calendar and time selection tool may be used.
- Now — This is the selection of the current date and time.
- Midnight — This is the selection of the current date and the time selection of midnight or (24:00hrs).
- Relative Date/Time — This option provides a text field in which a number can be manually entered and a drop-down box where the following options:
- End (Exclusive):
- Specific Date/Time — A manual date/time may be entered or the calendar and time selection tool may be used.
- Relative Date/Time — This option provides a text field in which a number can be manually entered and a drop-down box where the following options:
- Days After
- Seconds After
- Minutes After
- Hours After
- Weeks After
- Months After
- Quarters After
- Years After
- Now — This is the selection of the current date and time.
- Midnight — This is the selection of the current date and the time selection of midnight or (24:00hrs).
- Start (Inclusive):
- Advanced:
- Start (Inclusive) — Manually enter today or a specific desired start date.
- End (Exclusive) — Manually enter today or a specific desired end date.
- Previous:
- previous calendar week
- previous calendar month
- previous calendar year
- No filter:
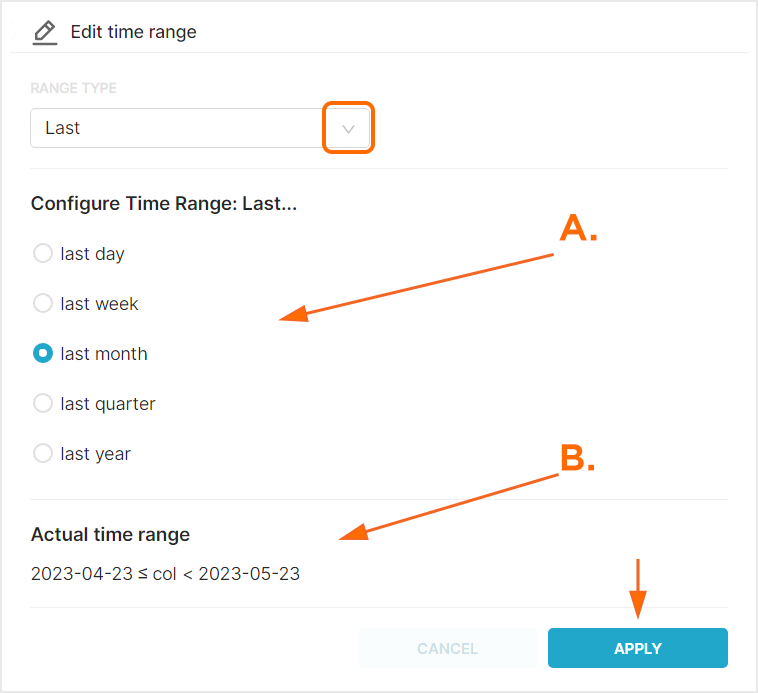
A. After range selection, select the desired time range.
B. Time range that will be displayed.
Currency:
By default cost data is displayed in US Dollars, however cost data may be displayed in a variety of other currency.
From the Currency drop-down menu select one of the following:
- AED
- AFN
- ALL
- AMD
- ANG
- AOA
- ARS
- AUD
- AWG
- AZN
- BAM
- BBD
- BDT
- BGN
- BHD
- BIF
- BMD
- BND
- BOB
- BRL
- BSD
- BTC
- BTN
- BWP
- BYN
- BYR
- BZD
- CAD
- CDF
- CHF
- CLF
- CLP
- CNH
- CNY
- COP
- CRC
- CUC
- CUP
- CVE
- CZK
- DJF
- DKK
- DOP
- DZD
- EEK
- EGP
- ERN
- ETB
- EUR
- FJD
- FKP
- GBP
- GEL
- GGP
- GHS
- GIP
- GMD
- GNF
- GTQ
- GYD
- HKD
- HNL
- HRK
- HTG
- HUF
- IDR
- ILS
- IMP
- INR
- IQD
- IRR
- ISK
- JEP
- JMD
- JOD
- JPY
- KES
- KGS
- KHR
- KMF
- KPW
- KRW
- KWD
- KYD
- KZT
- LAK
- LBP
- LKR
- LRD
- LSL
- LYD
- MAD
- MDL
- MGA
- MKD
- MMK
- MNT
- MOP
- MRU
- MVR
- MWK
- MXN
- MYR
- MZN
- NAD
- NGN
- NIO
- NOK
- NPR
- NZD
- OMR
- PAB
- PEN
- PGK
- PHP
- PKR
- PLN
- PYG
- QAR
- RON
- RSD
- RUB
- RWF
- SAR
- SBD
- SCR
- SDG
- SEK
- SGD
- SHP
- SLL
- SOS
- SRD
- SSP
- STD
- STN
- SVC
- SYP
- SZL
- THB
- TJS
- TMT
- TND
- TOP
- TRY
- TTD
- TWD
- TZS
- UAH
- UGX
- USD
- UYU
- UZS
- VES
- VND
- VUV
- WST
- XAF
- XAG
- XAU
- XCD
- XDR
- XOF
- XPD
- XPF
- XPT
- YER
- ZAR
- ZMW
- ZWL
After filters have been selected, you must click Apply Filters before the graphic displays or row level data will be updated.
Graphic Display
The graphic display provides the ability to view interactive charts for each pre-built view. Mousing over the charts displays the corresponding data.
The vertical axis of the graph represents the installs, clicks, impression and spend totals. The horizontal axis displays the represented network partners. Each metric (i.e., installs, clicks, impressions and spend) are represented with a specific color on the graph.
Mousing over a partner column will display the metric data for that specific partner.
A row level table is displayed below the SKAdNetwork Install Match Type graph showing Partner Campaign Names, Sum of SKadNetwork Installs, Sum of SKadNetwork Match Type Impressions, SKAdNetwork Match Type Impression %, Sum of SKAdNetwork Match Type Clicks, SKAdNetwork Match Type Click % and the Sum of Spend. The data that is being displayed can be organized by any of the columns by clicking on the up/down arrows next to the desired column.
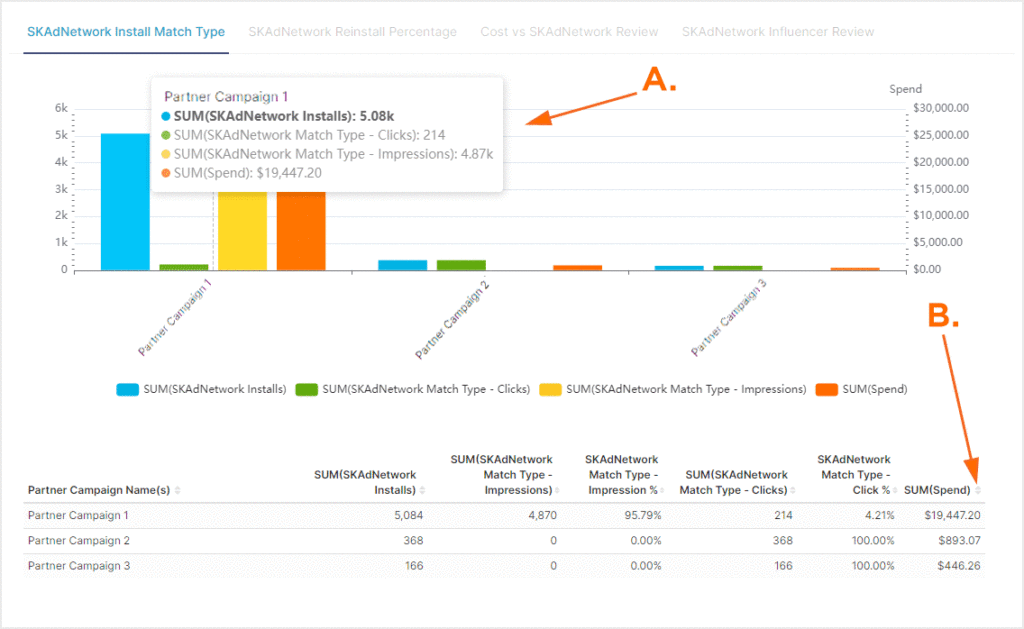
A. Mouse over the partner column to display the corresponding metric data.
B. Organize data by desired column.
The vertical axis of the graph represents the installs, reinstalls, reinstall % and spend totals. The horizontal axis displays the represented network partners. Each metric (i.e., installs, reinstalls and spend) are represented with a specific color on the graph.
Mousing over a partner column will display the metric data for that specific partner.
A row level table is displayed below the SKAdNetwork Reinstall Percentage graph showing Partner Campaign Names, Sum of SKAdNetwork Reinstalls, SKAdNetwork Reinstall % and the Sum of Spend. The data that is being displayed can be organized by any of the columns by clicking on the up/down arrows next to the desired column.
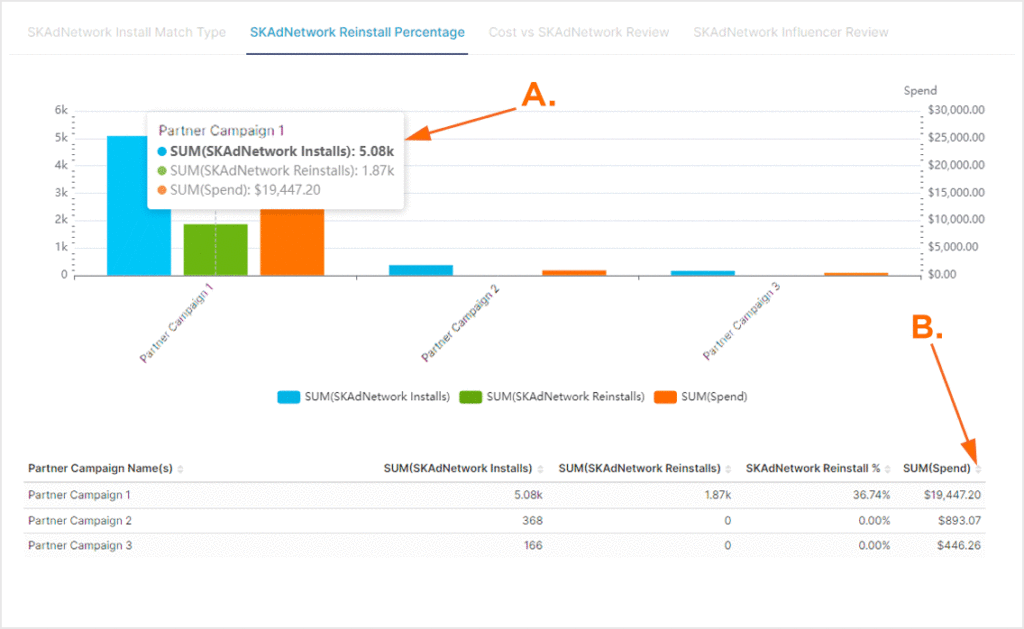
A. Mouse over the partner column to display the corresponding metric data.
B. Organize data by desired column.
The Cost vs. SKAdNetwork Review provides two bar graphs. The first bar graph compares the cost of installs vs. the number of SKAdNetwork installs. The second graph compares CPI vs. the CPI for SKAdNetwork. The vertical axis of the bar graphs displays the cost values and the horizontal axis displays the represented network partners. Each metric (i.e., Cost of Installs, SKAdNetwork Installs, Cost Per Install and SKAdNetwork Cost Per Install) are represented with a specific color on the graph.
Mousing over a partner column will display the metric data for that specific partner.
A row level table is displayed below the SKAdNetwork Cost vs. SKAdNetwork graphs showing Partner Campaign Names, the Sum of Total Impressions, Clicks, Install, CVR, Sum of Spend, CPI and SKAdNetwork CPI. The data that is being displayed can be organized by any of the columns by clicking on the up/down arrows next to the desired column.
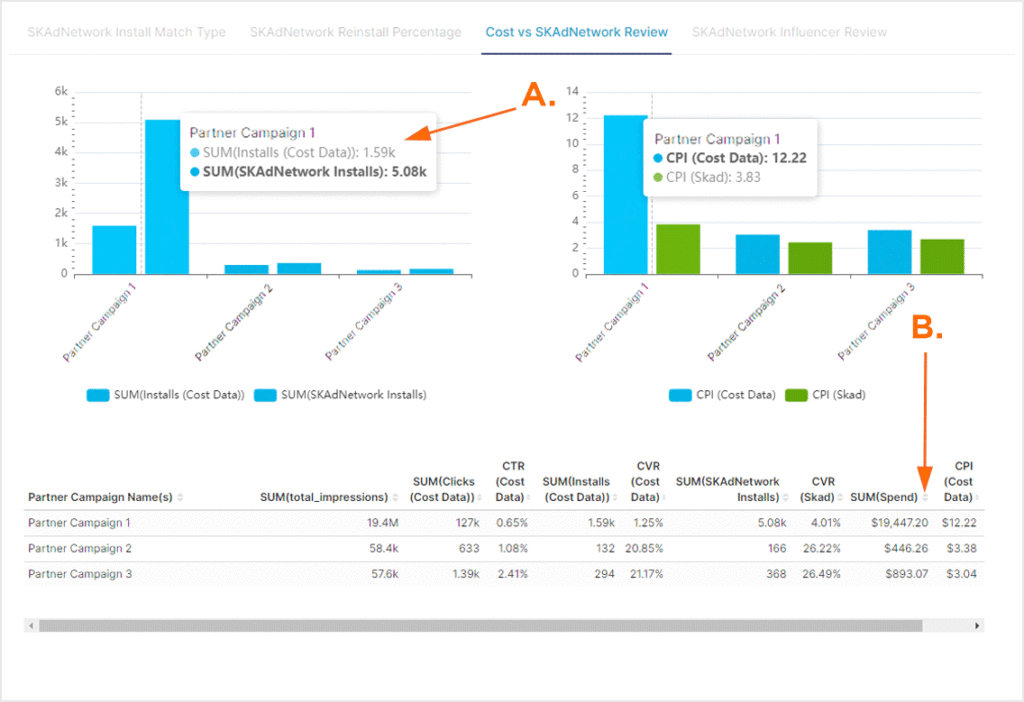
A. Mouse over the partner column to display the corresponding metric data.
B. Organize data by desired column.
The SKAdNetwork Influencer Review graph provides visibility for the number of the Impressions and Clicks influenced by SKAdNetwork. The vertical axis of the bar graphs displays the totals for impressions and clicks, and the horizontal axis displays the represented network partners. Each metric (i.e., Clicks and Impressions) are represented with a specific color on the graph.
Mousing over a partner column will display the metric data for that specific partner.
A row level table is displayed below the influencer graph showing Partner Campaign Names, Installs, Impressions, Impression Ratio, Clicks, Click Ratio, SKAdNetwork Influencer Ratio and the Sum of total Spend. The data that is being displayed can be organized by any of the columns by clicking on the up/down arrows next to the desired column.
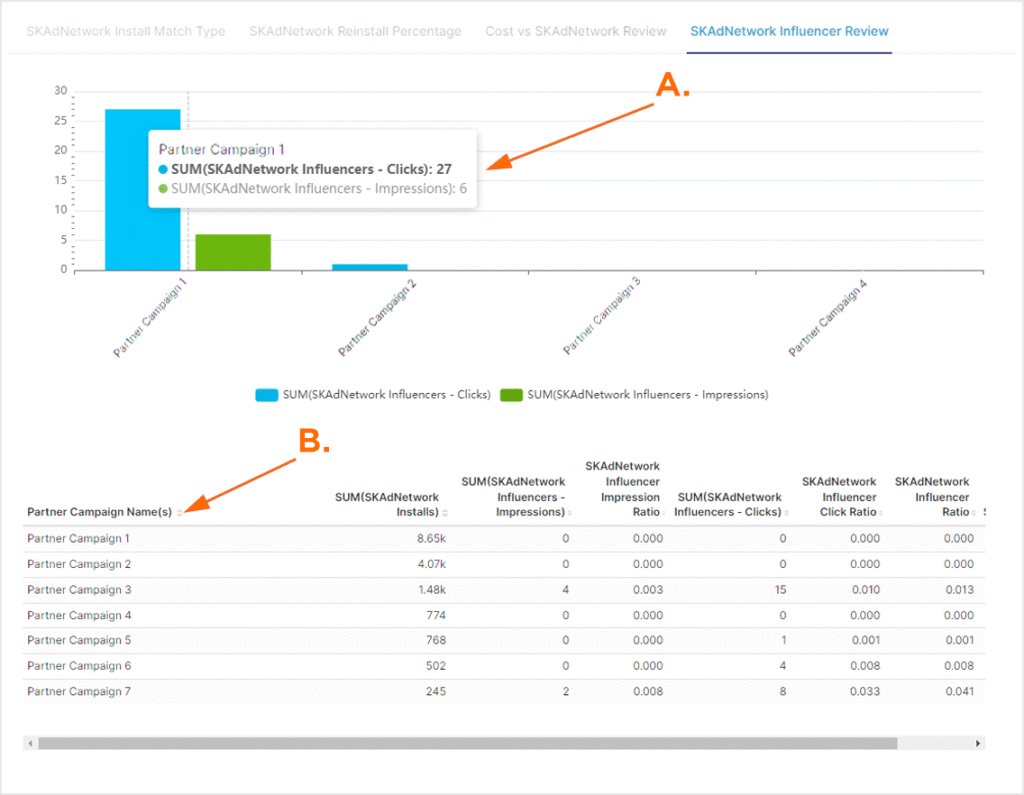
A. Mouse over the partner column to display the corresponding metric data.
B. Organize data by desired column.