
NOTE: When an account only has one app set up, Kochava will automatically select the app.
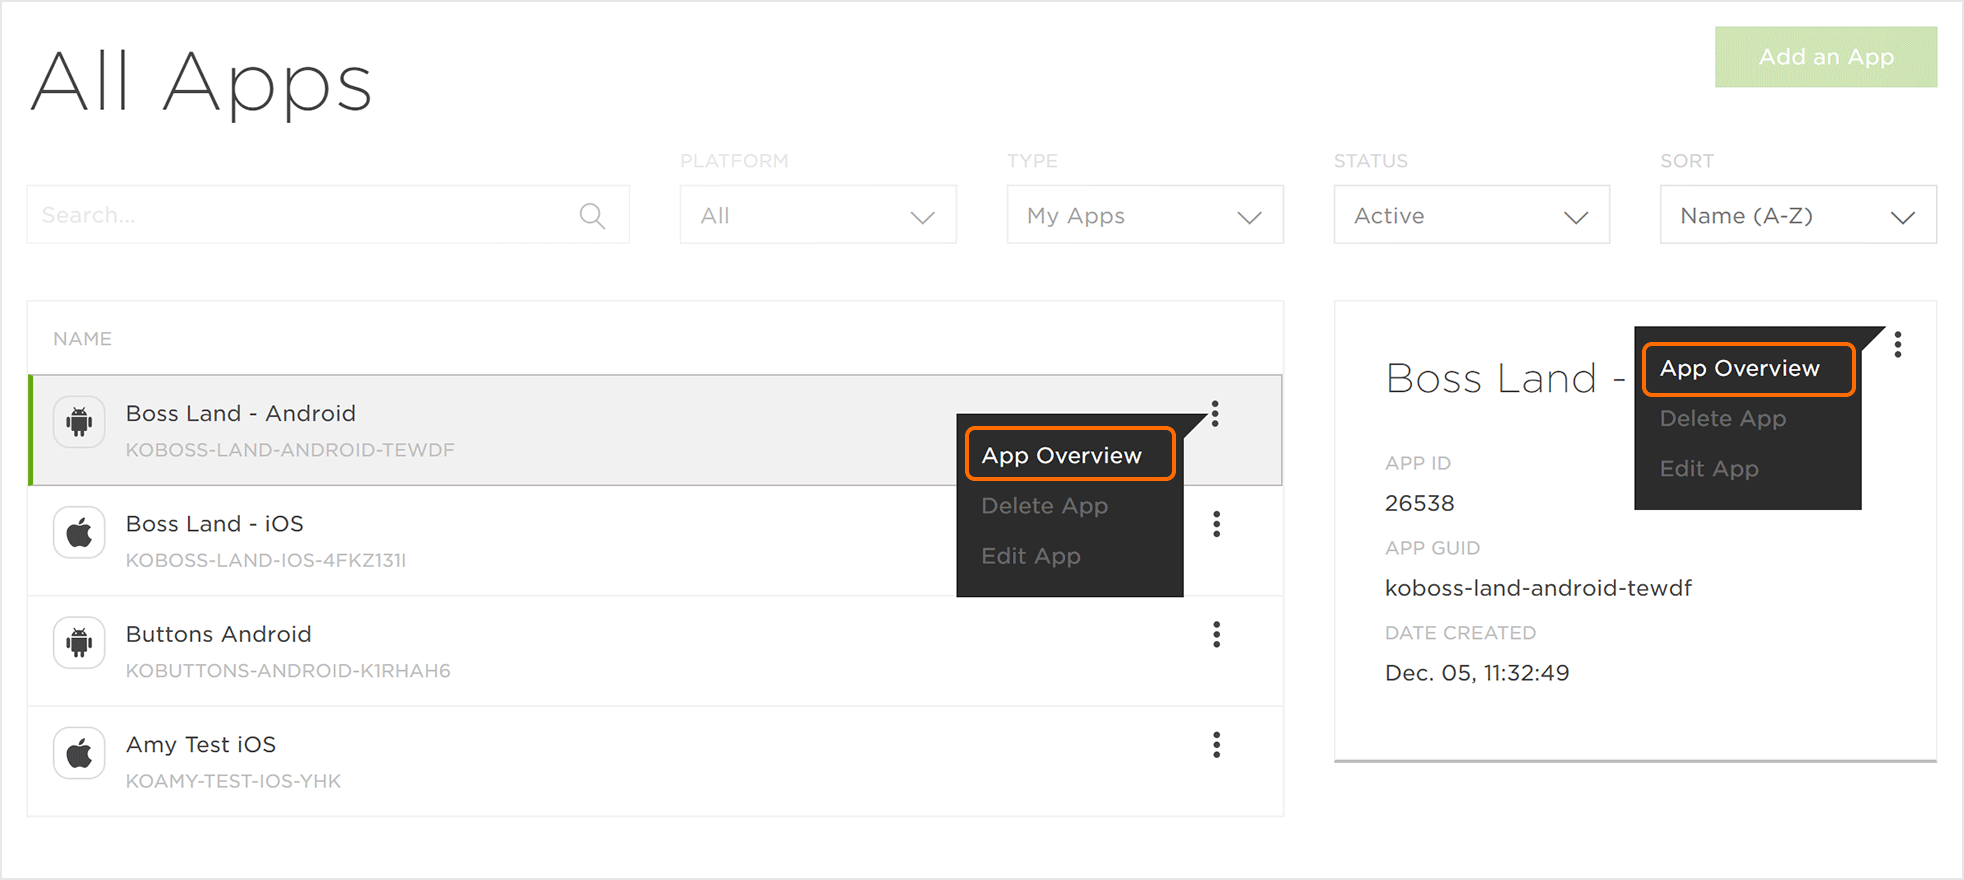
NOTE: The All Apps page provides an Analytics icon allowing the user to easily navigate to the Analytics Overview page for that specific app.
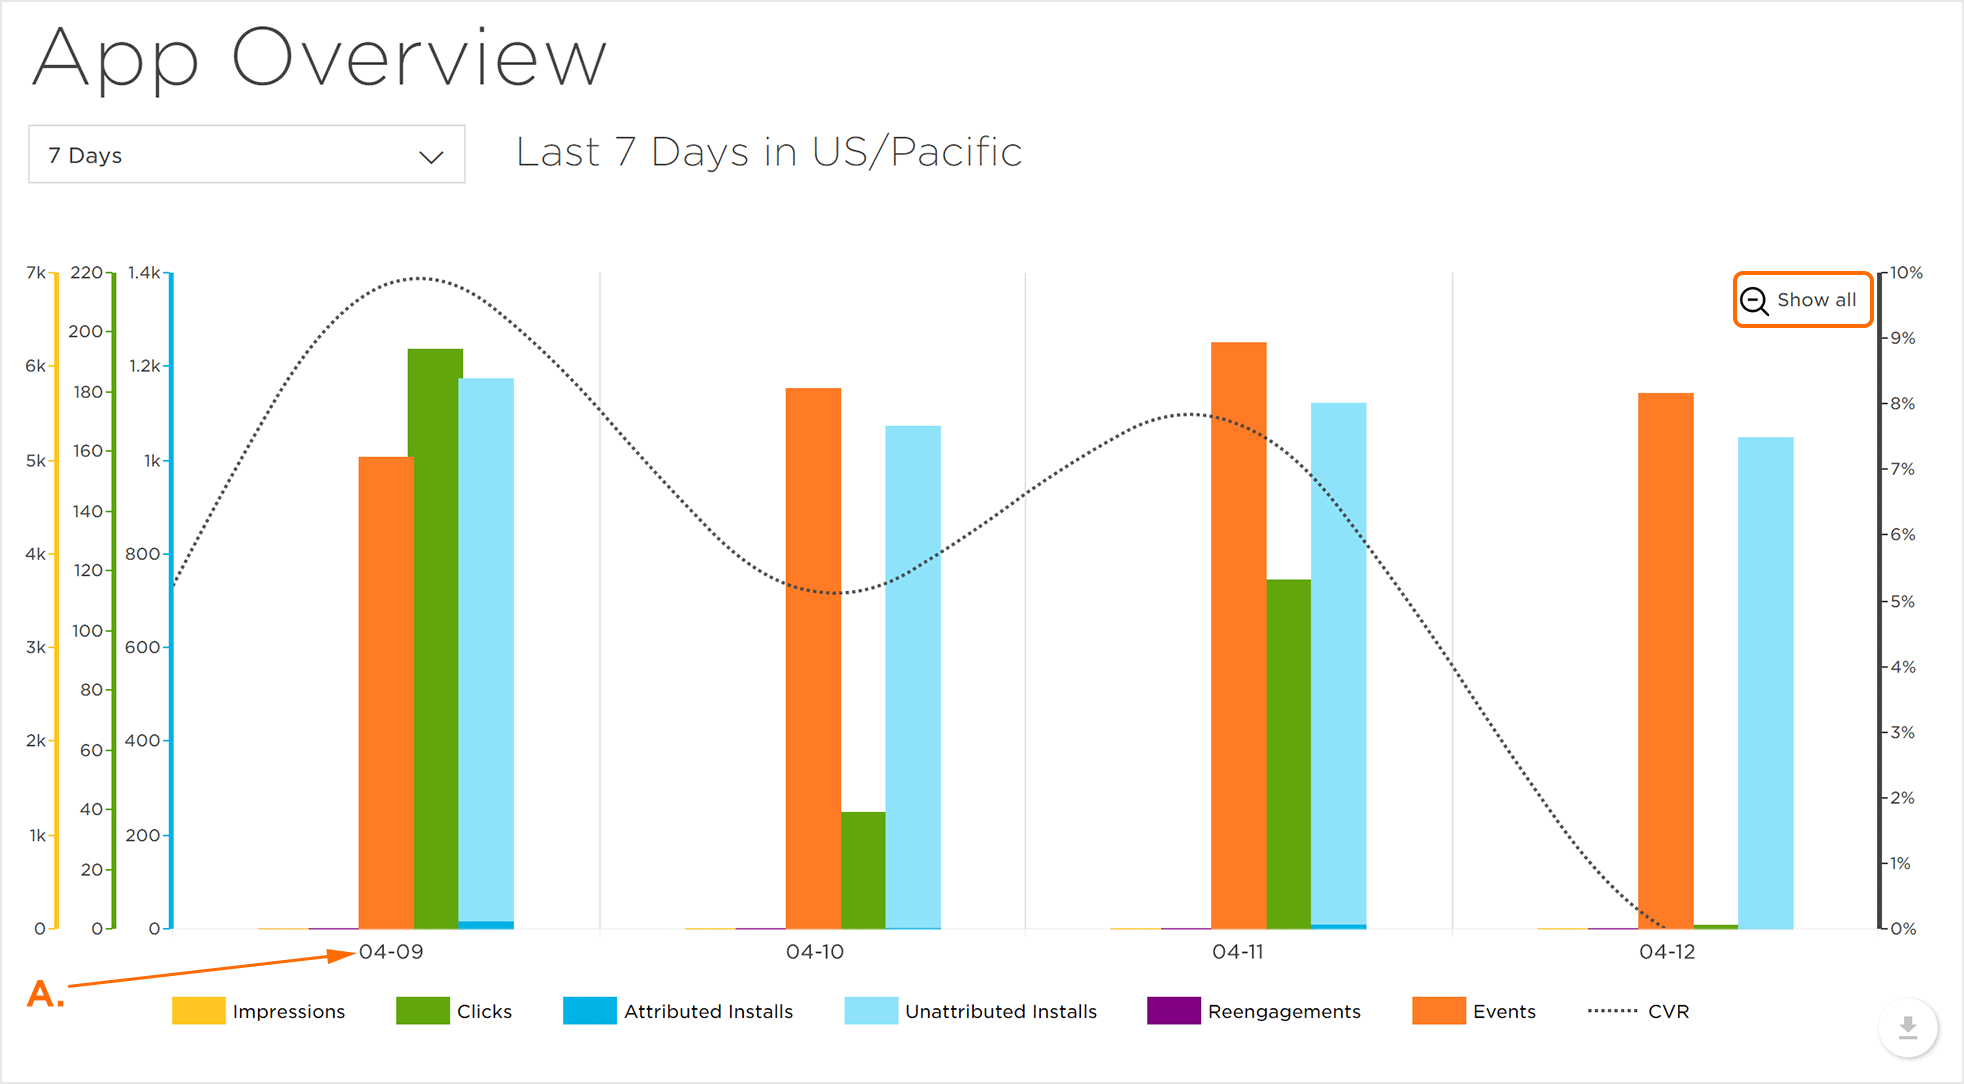
App Overview Interface
- Log in to Kochava.
- Select the desired Account and App.
- Select App Tools (⋮) > App Overview.
Setting Data Duration:
NOTE: By default, the data displayed in the App Overview page is set to seven days.
- Click the Data Duration drop-down menu.
- Select the desired Duration:
- 7 Days (default)
- 14 Days
- 30 Days
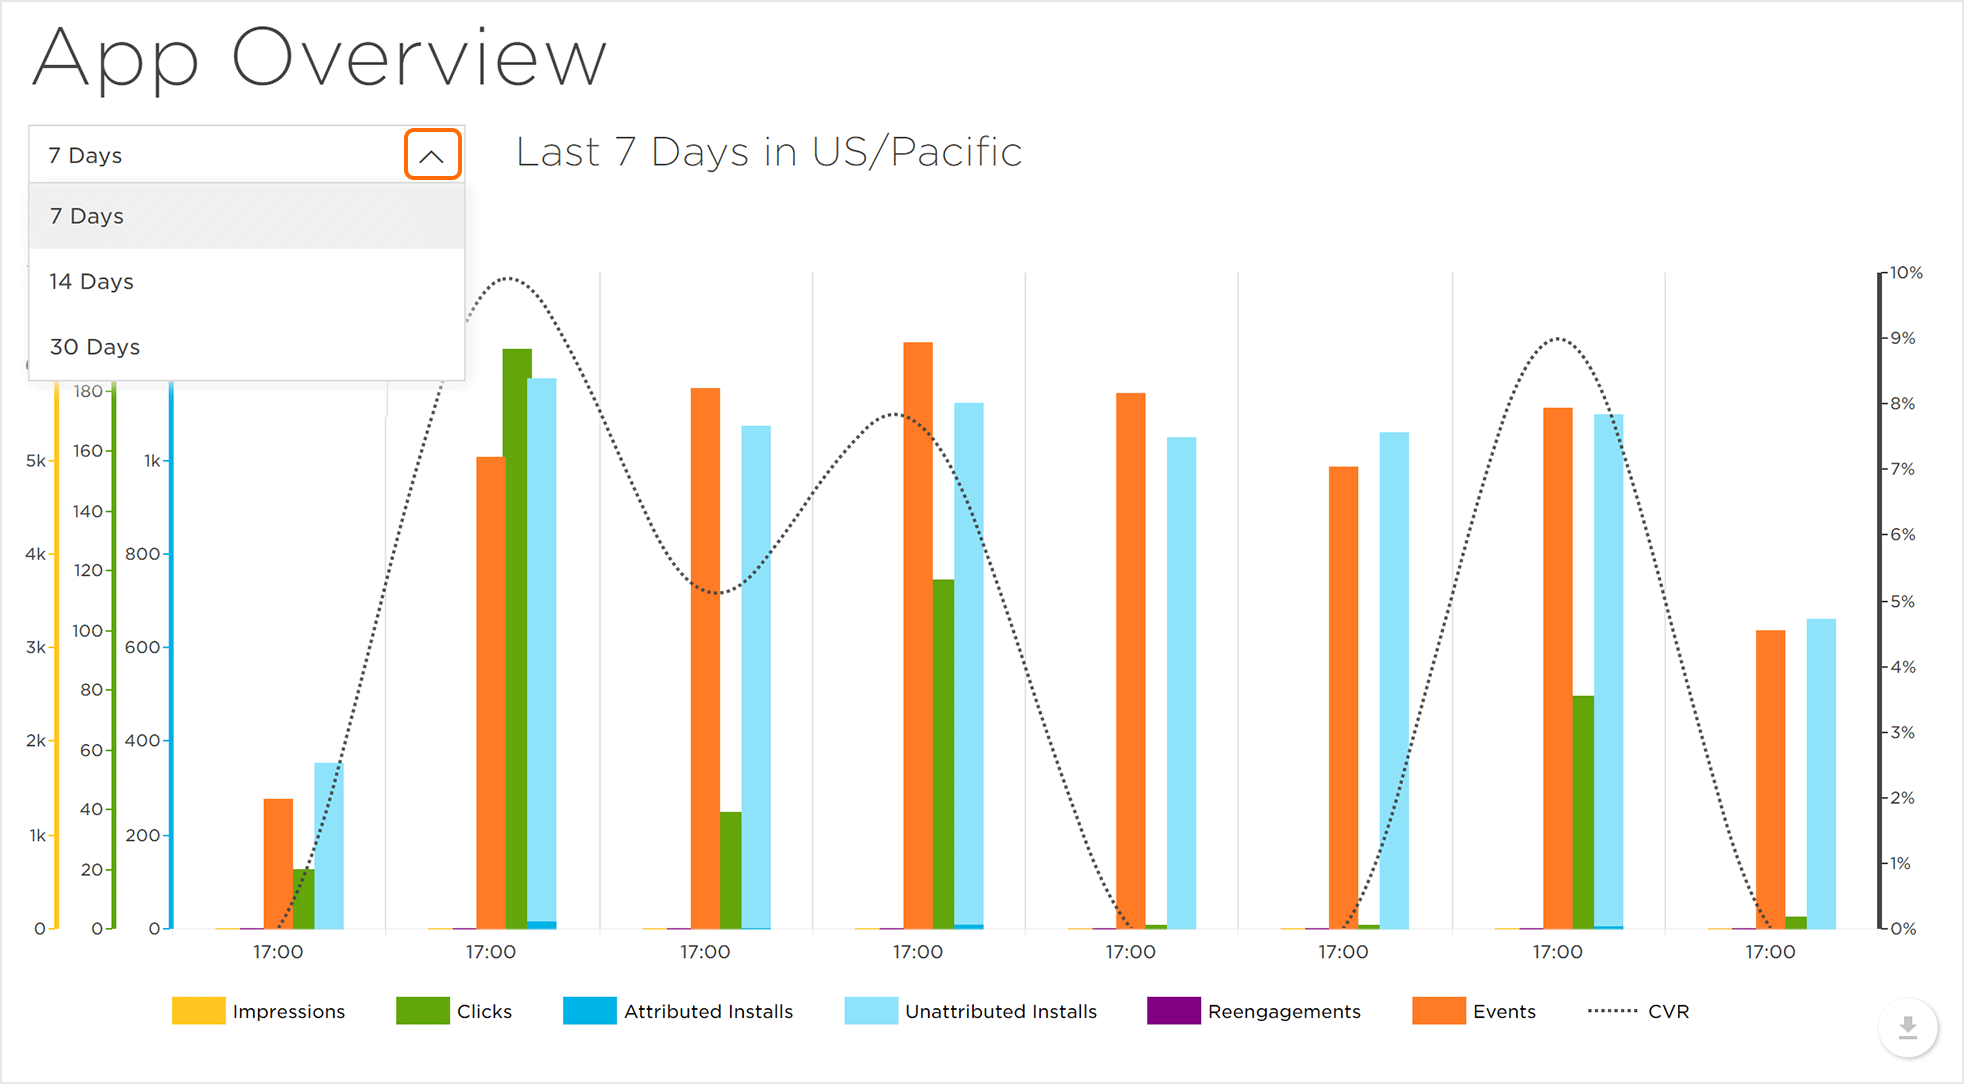
App Overview Chart
The App Overview chart is a representation of the Impressions, Clicks, Attributed Installs, Unattributed Installs, Reengagements, Events and Conversion Rate (CVR) associated to the app within the selected data duration.
NOTE: By default, the overview chart only displays Impressions, Clicks, Attributed Installs, Reengagement and CVR. Clicking on metrics will display or hide metrics within the chart.
The app overview chart is responsive to the metrics and data duration selected; mousing over the chart displays metric specific data. The vertical axis is color coded for easy identification and displays each metric’s volume. The horizontal axis represents the data duration selected.
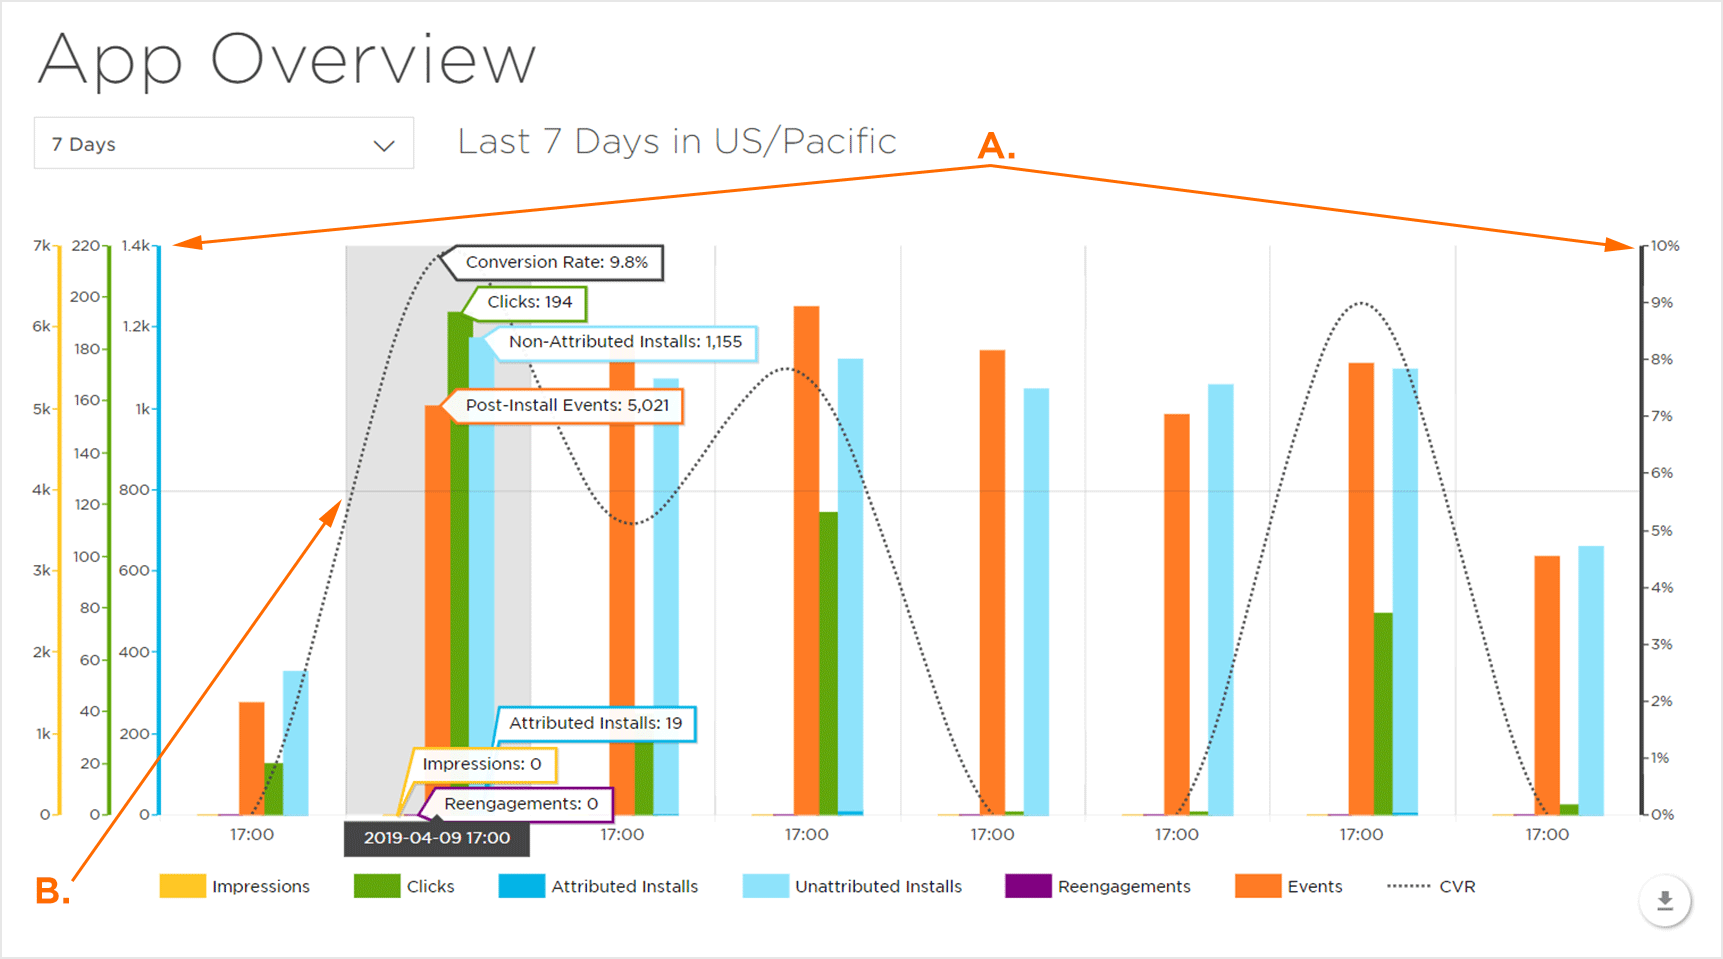
B. Mouse Over to display data.
While mousing over the interactive chart Click, Hold and Drag to refine the date range.
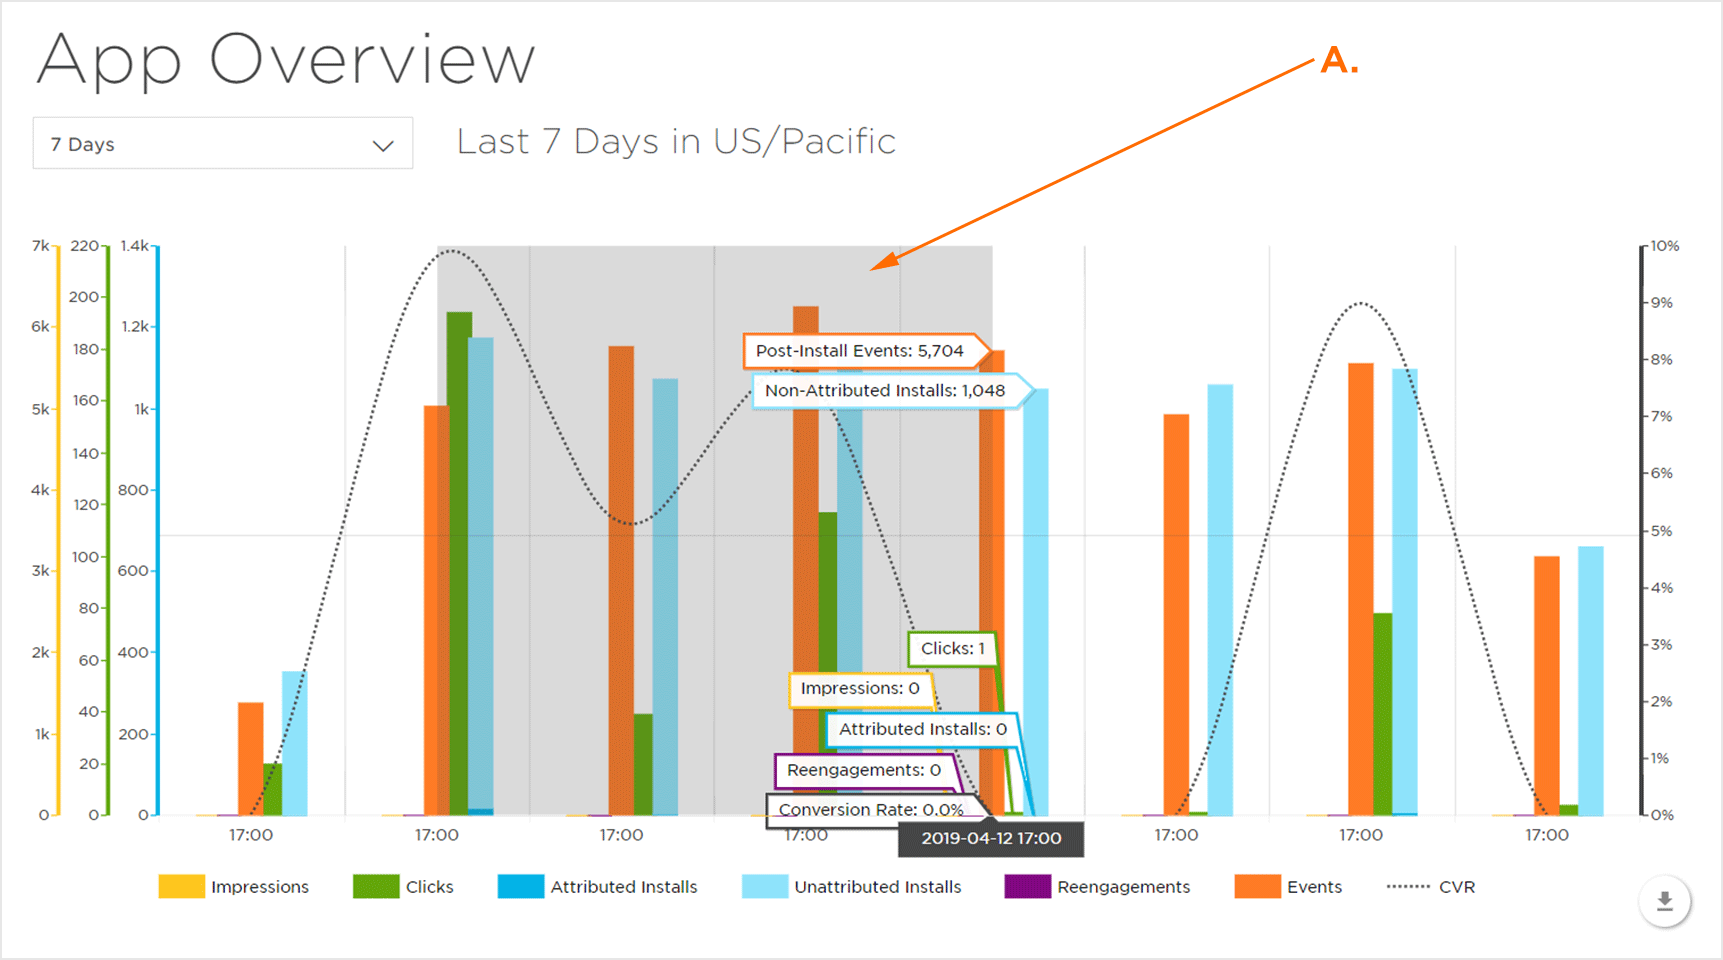
Click Show all to return to the full data duration.
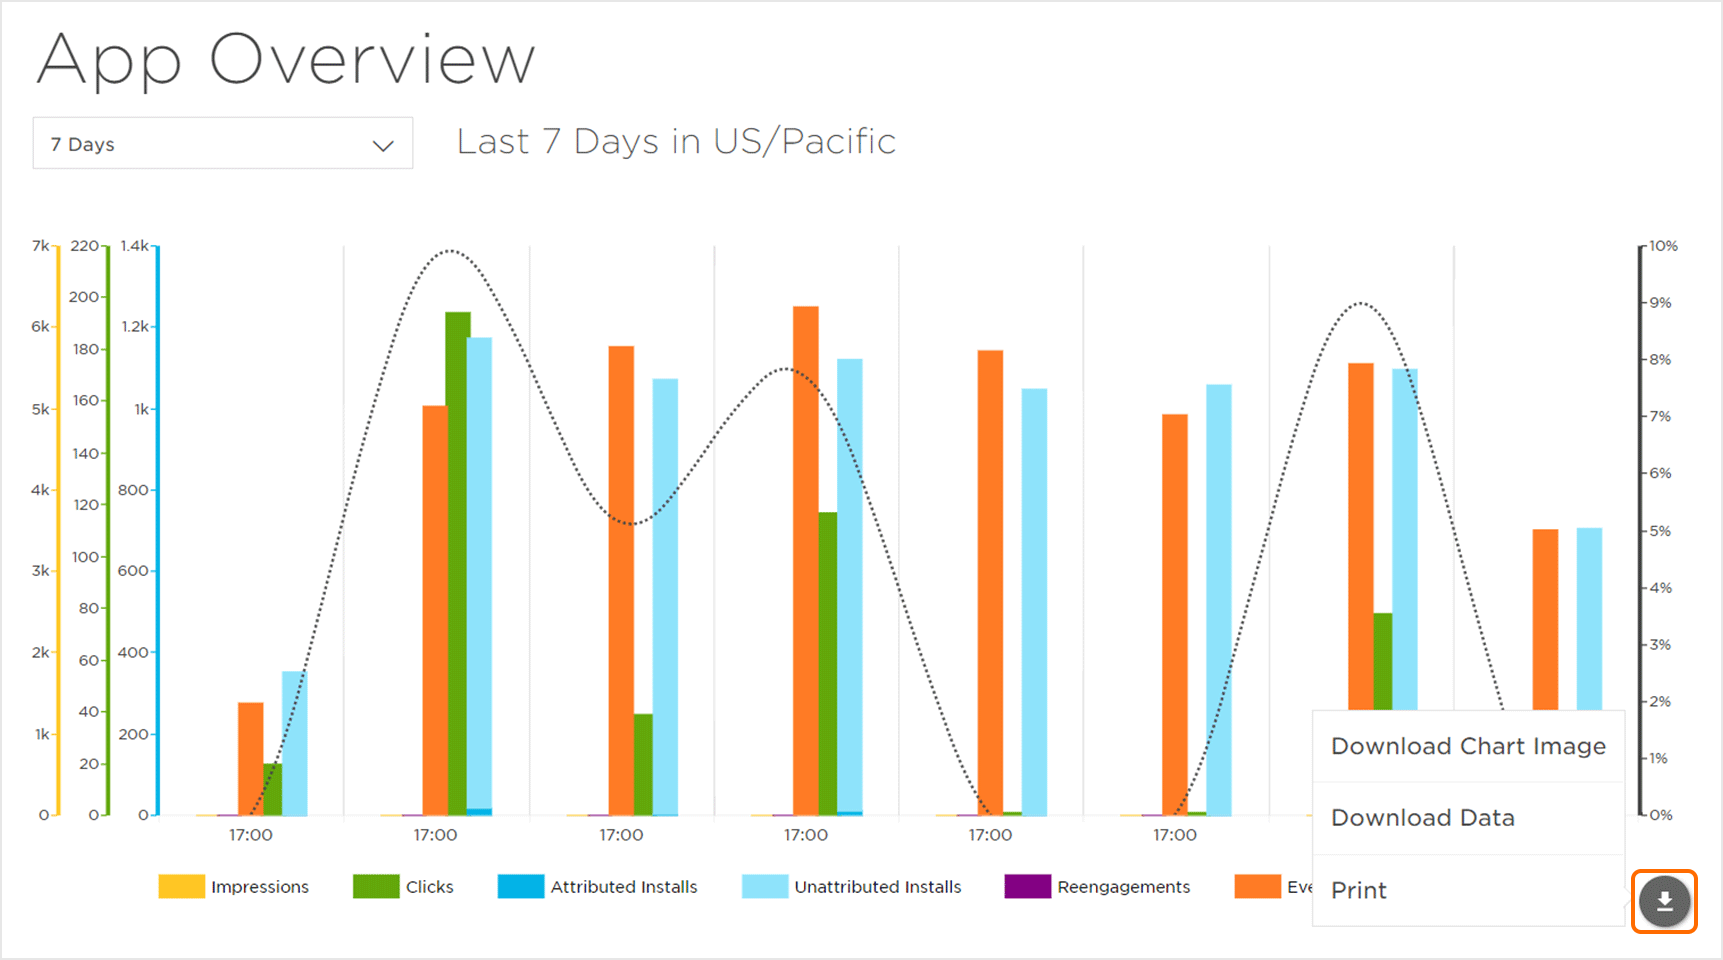
Downloading the App Overview Chart Data
The data displayed within the App Overview chart can be downloaded in the following formats:
Download Graphically:
Click the Download Button > Select Download Chart Image> Select a file format:- PNG
- JPG
- SVG
Download Data:
Click the Download Button > Select Data>CSV.
Print Data:
Click the Download Button > Select Print.
Network Performance
The Network Performance section displays the Impression, Click, Install, Reengagement, Event and CVR data associated with each network. The data within the Network Performance section can be organized order by any of the metrics in ascending or descending order by clicking on the metric. Network performance can be further expanded in Analytics Explorer by mousing over the desired network and clicking on the binocular icon.
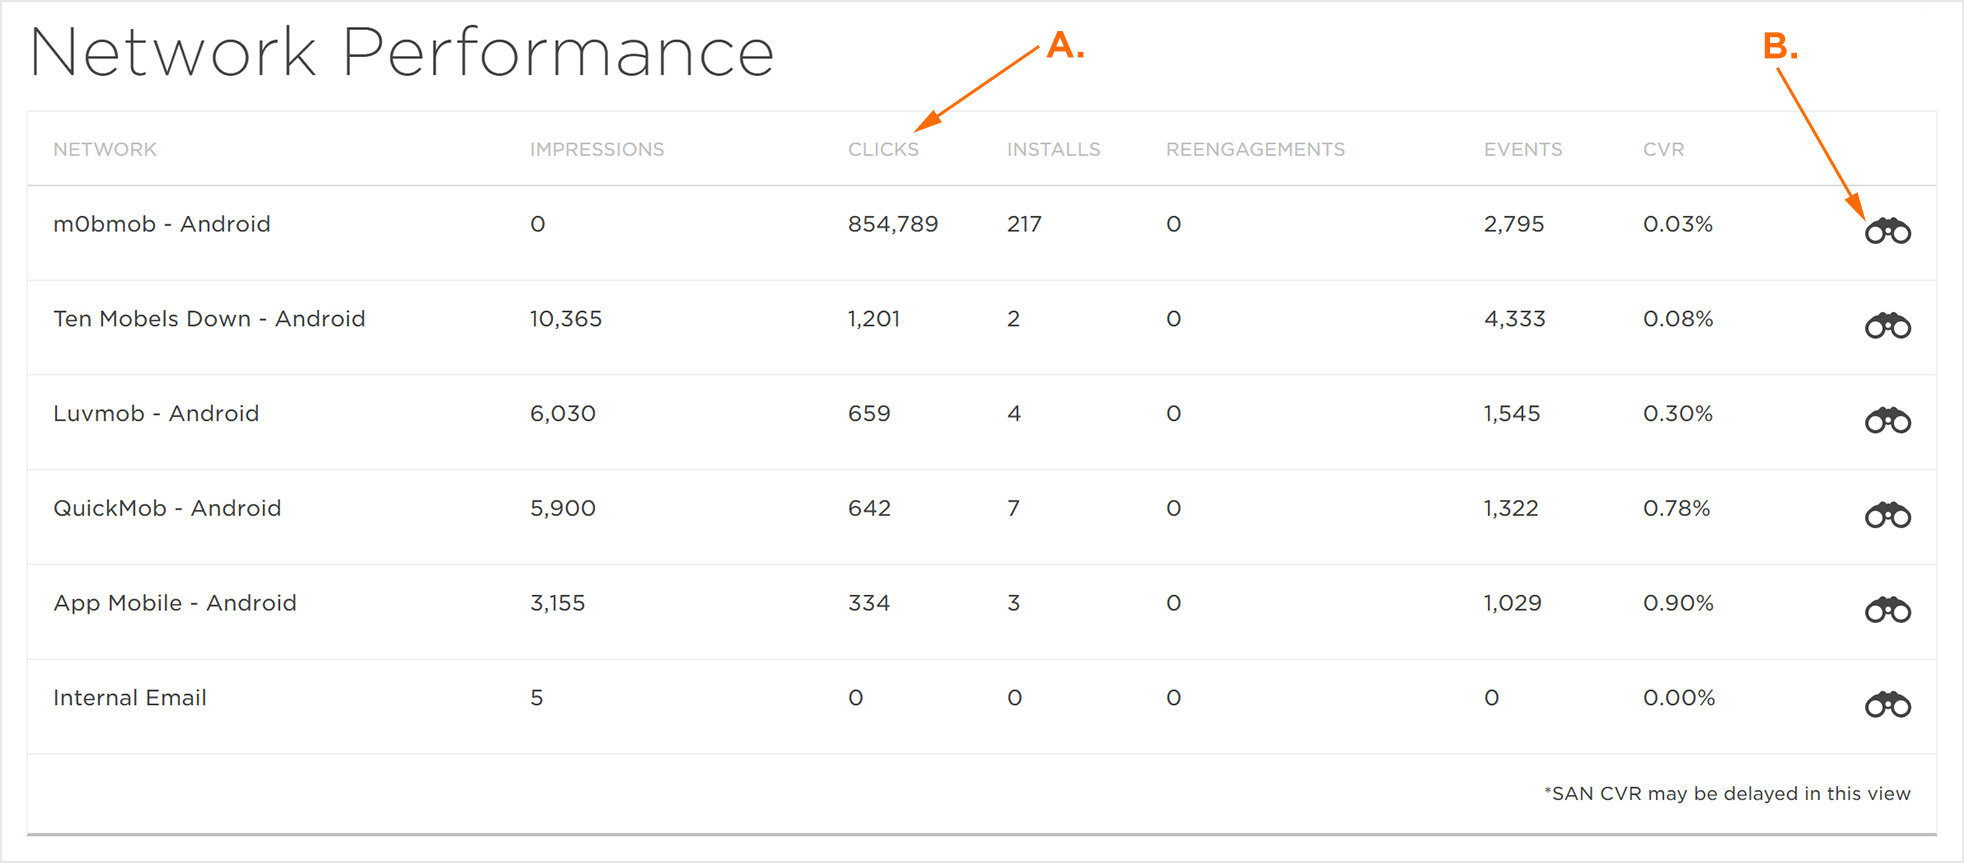
B. Click or view network data in Analytics Explorer.