Analytics Interface
- Log in to Kochava.
- Select the desired Account and App.
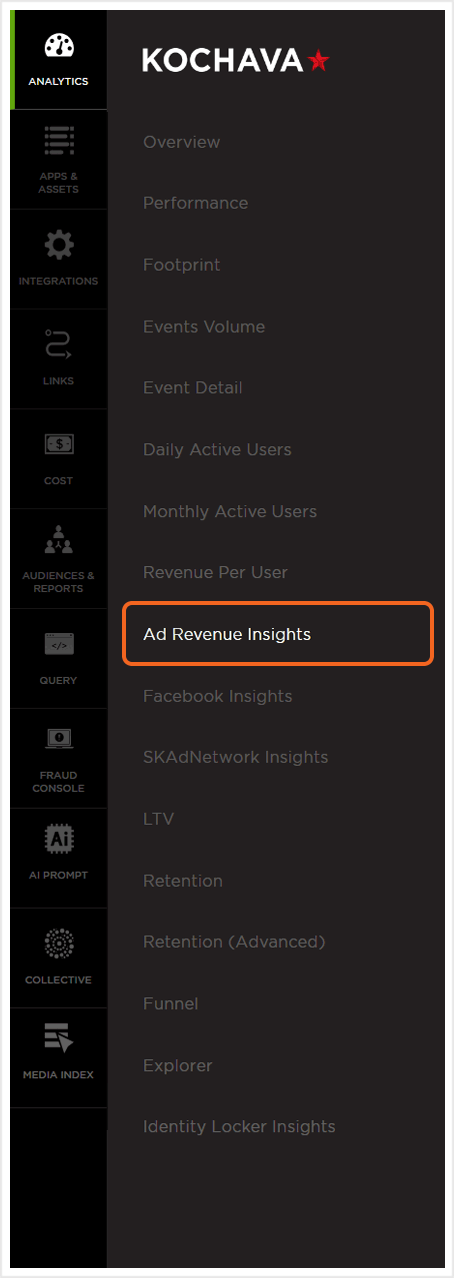
- Select Analytics > Ad Revenue Insights.
Configuration Settings
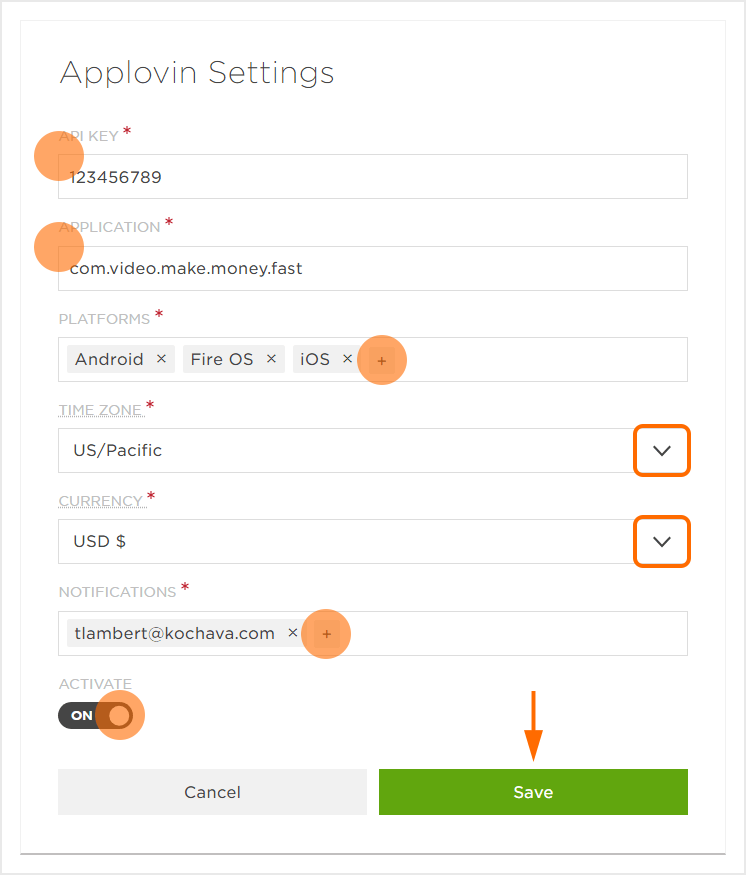
AppLovin MAX:
- Click on AppLovin MAX.
- Enter the API Key.
- Enter the Application.
- Add the required Platforms.
- Select the desired Currency.
- Select the desired Notifications recipients.
- Click Activate.
- Click Save.
NOTE: Platforms may be removed by clicking on the associated “X“.
NOTE: By default the currently logged in user will be added to the notification list.
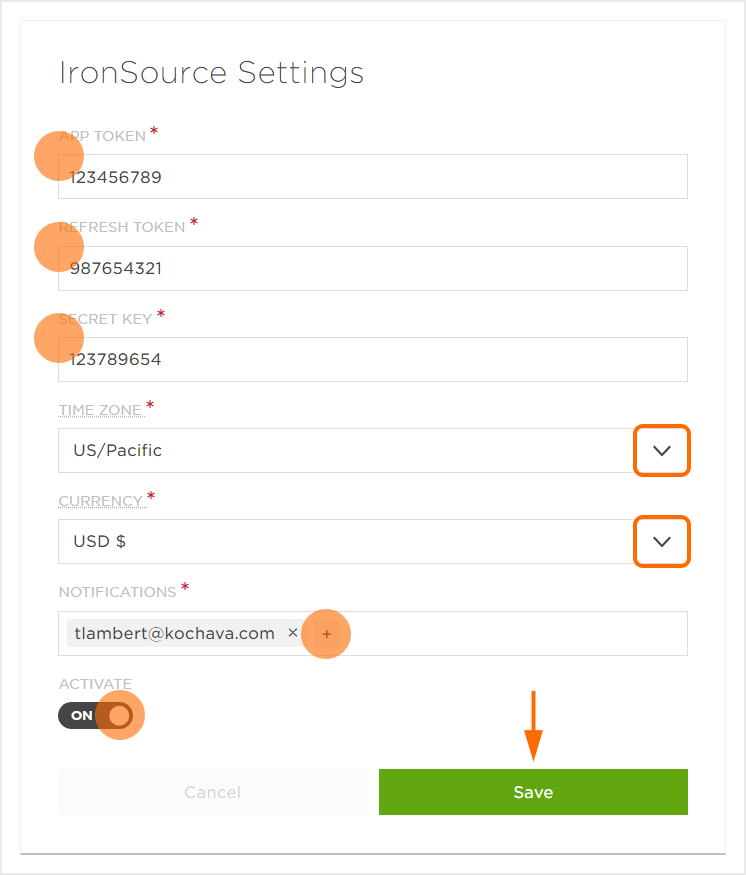
ironSource Settings:
- Click on ironSource.
- Enter the App Token.
- Enter the Refresh Token.
- Enter the Secret Key.
- Select the desired Time Zone.
- Select the Currency.
- Select the desired Notifications recipients.
- Click Activate.
- Click Save.
NOTE: By default the currently logged in user will be added to the notification list.
Data Display
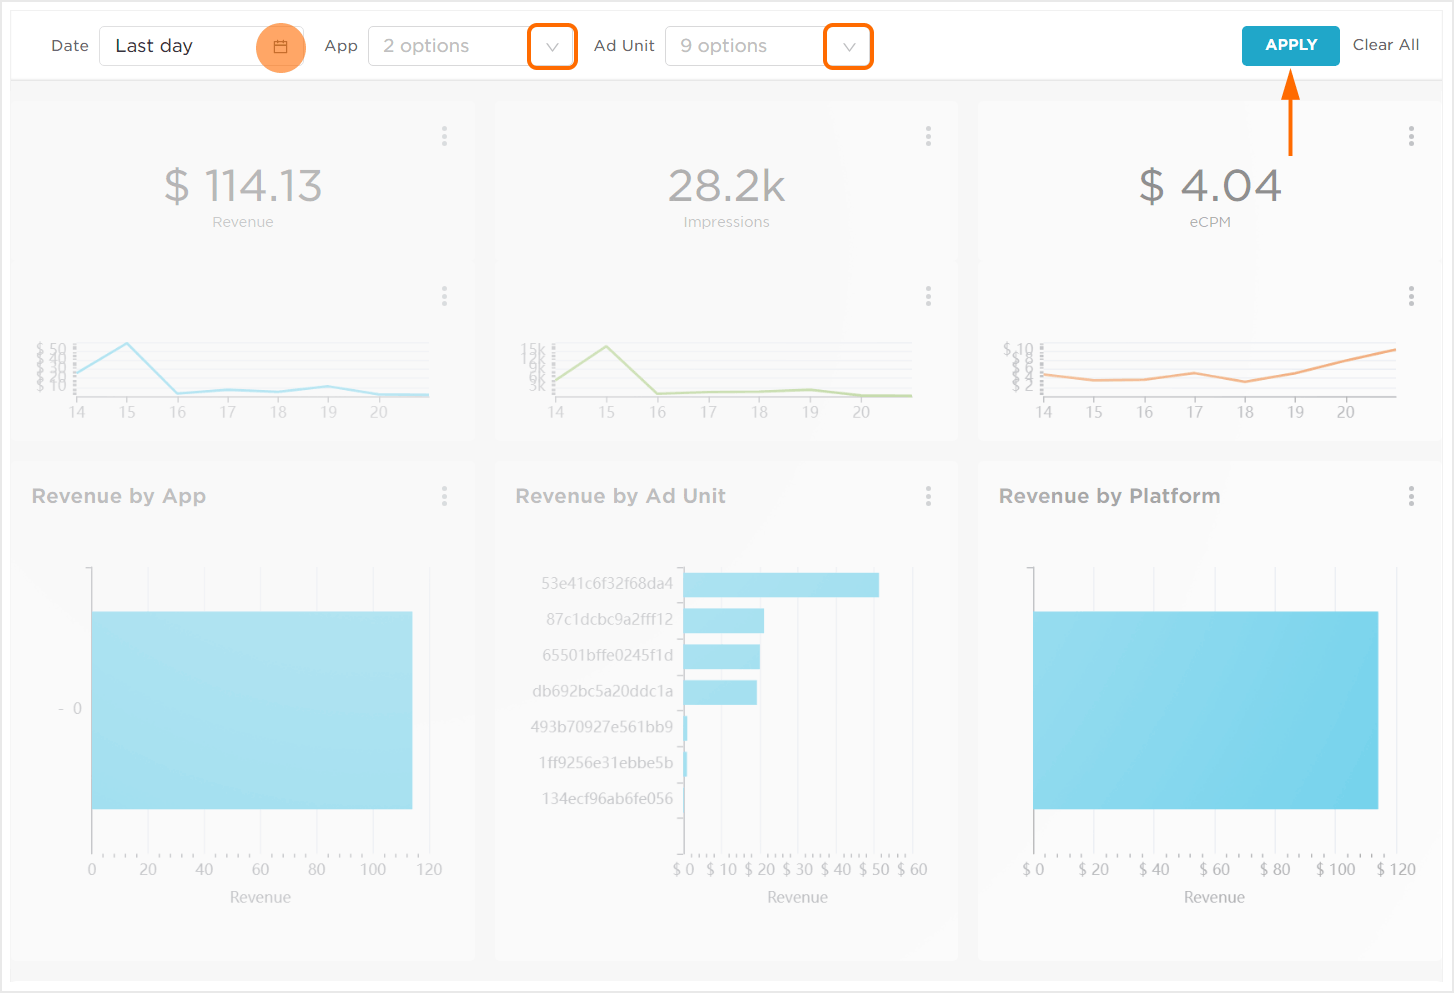
The Data Display section provides visual views of the data associated by date, app and ad unit.
Data Display Settings:
The Data Display section provides the ability to filter data that is being displayed by selected the desired option from date, app or ad unit.
NOTE: Once the desired data display settings have been selected, Apply must be clicked to display the changes.
Date —
The date field provides the ability to filter the data by:
Range Type
- Last:
- last day
- last week
- last month
- last quarter
- last year
- Previous:
- previous calendar week
- previous calendar month
- previous calendar year
- Custom:
- Select a Start (Inclusive) date range:
- Relative Date/Time – Enter the timeframe before.
- Specific Date/Time – Enter a desired date and time.
- Now – The current date and time.
- Midnight – 12:00:00 am
- Select a End (Exclusive) date range:
- Relative Date/Time – Enter the timeframe before.
- Specific Date/Time – Enter a desired date and time.
- Now – The current date and time.
- Midnight – 12:00:00 am
- Advanced:
- No Filter
Hardcode the start and end date range.
App —
This option provides the ability to select a single App or all App data to be displayed.
Ad Unit —
This option provides the ability to select a single Ad Unit or all Ad Unit data to be displayed.
Data Tiles:
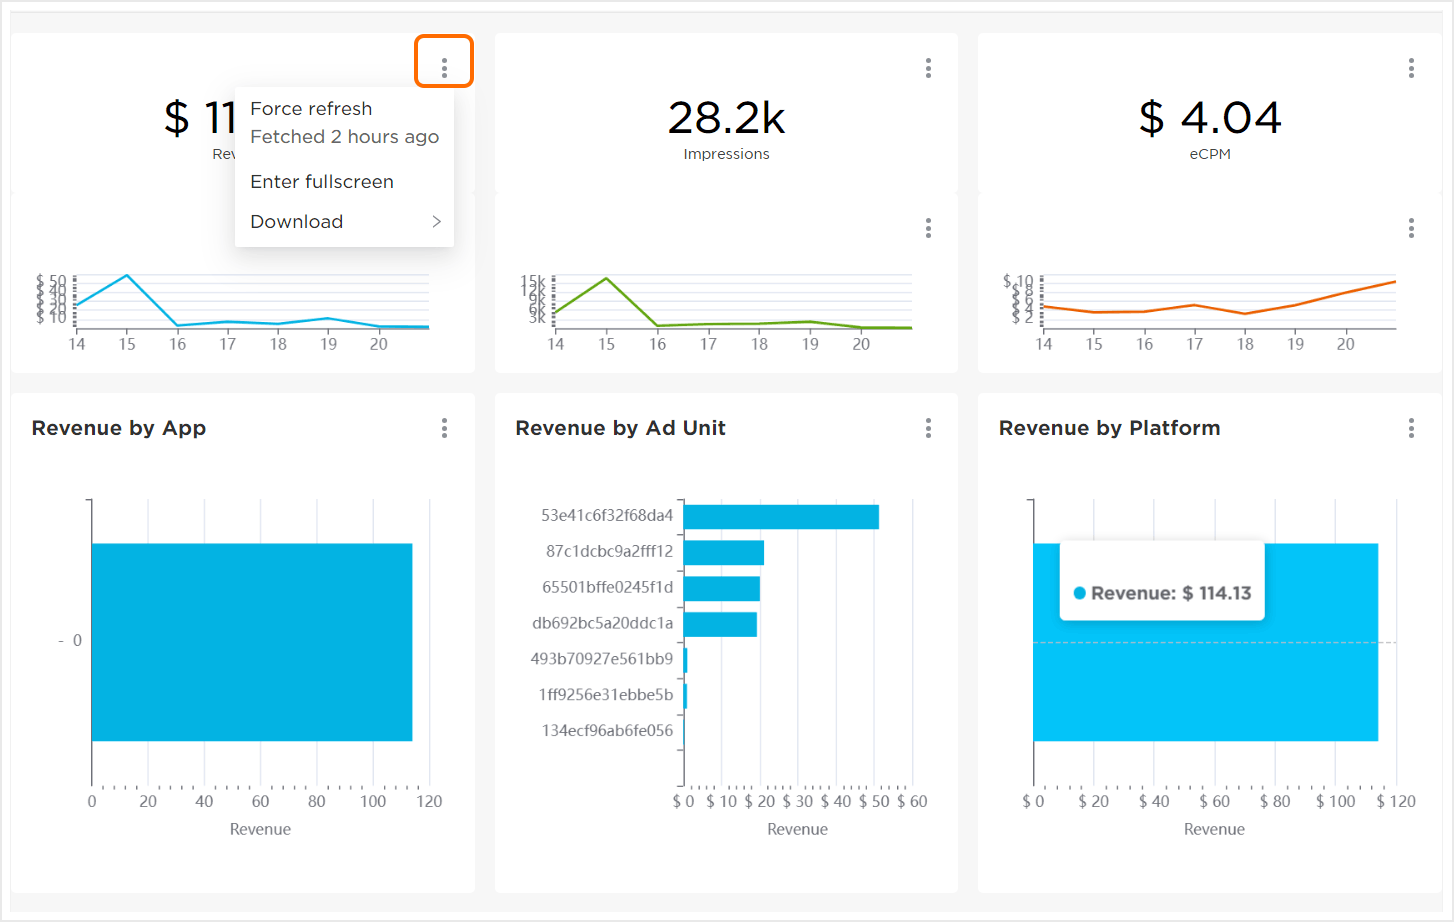
Data tiles provide a quick way to visually review the Revenue, Impressions, eCPM, Revenue by App, Revenue by Ad Unit and Revenue by Platform.
Each data tile provides the ability to force a refresh of the data, enter full screen to review the data or download the data (.CVS, Excel or Image). Mousing over the data tile will display the associated revenue.
Ad Unit Index Table:
The Ad Unit Index Table displays the eCPM, Index and Variance to Mean by Ad Unit. The data within the table can be organized by any of the columns by clicking on the desired column title. Clicking on a specific Ad Unit will update the data tiles and charts to display the associated data for that Ad Unit.
The table also has the ability to force a refresh of the data, enter full screen to review the data or download the data (.CVS, Excel or Image).

Revenue Chart:
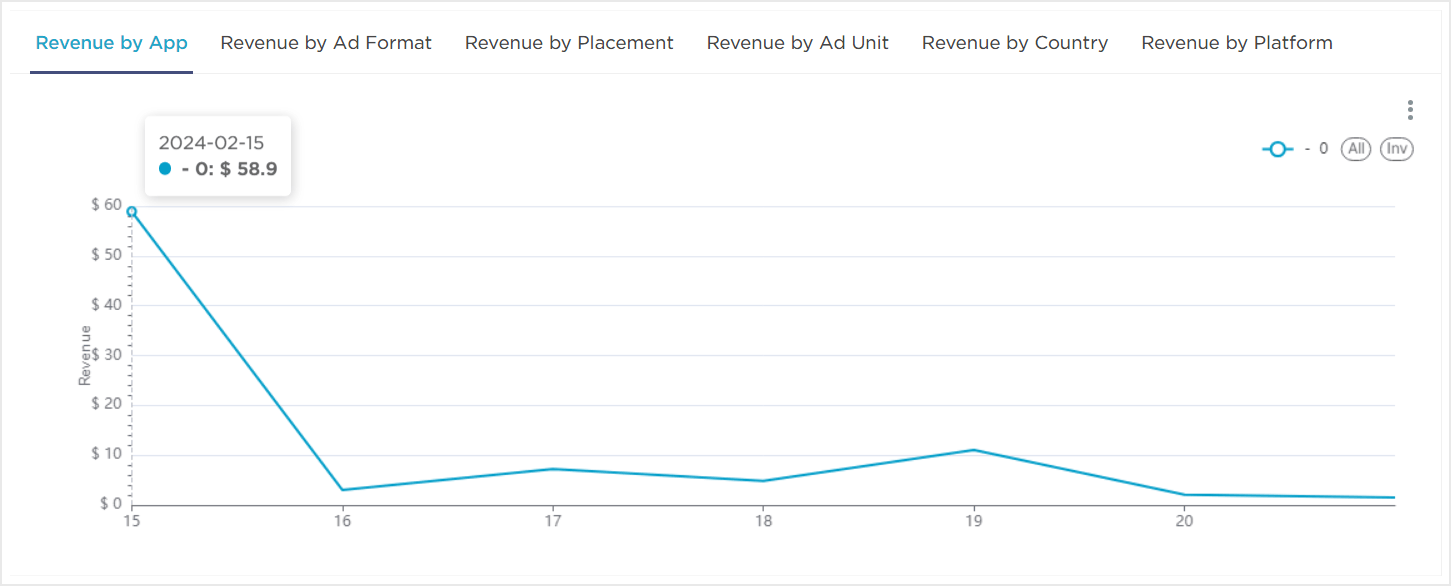
The Revenue Chart provides a visual breakdown of revenue by App, Ad Format, Placement, Ad Unit, Country and Platform. Mousing over the chart will display the associated revenue and date.
The chart also has the ability to force a refresh of the data, enter full screen to review the data or download the data (.CVS, Excel or Image).
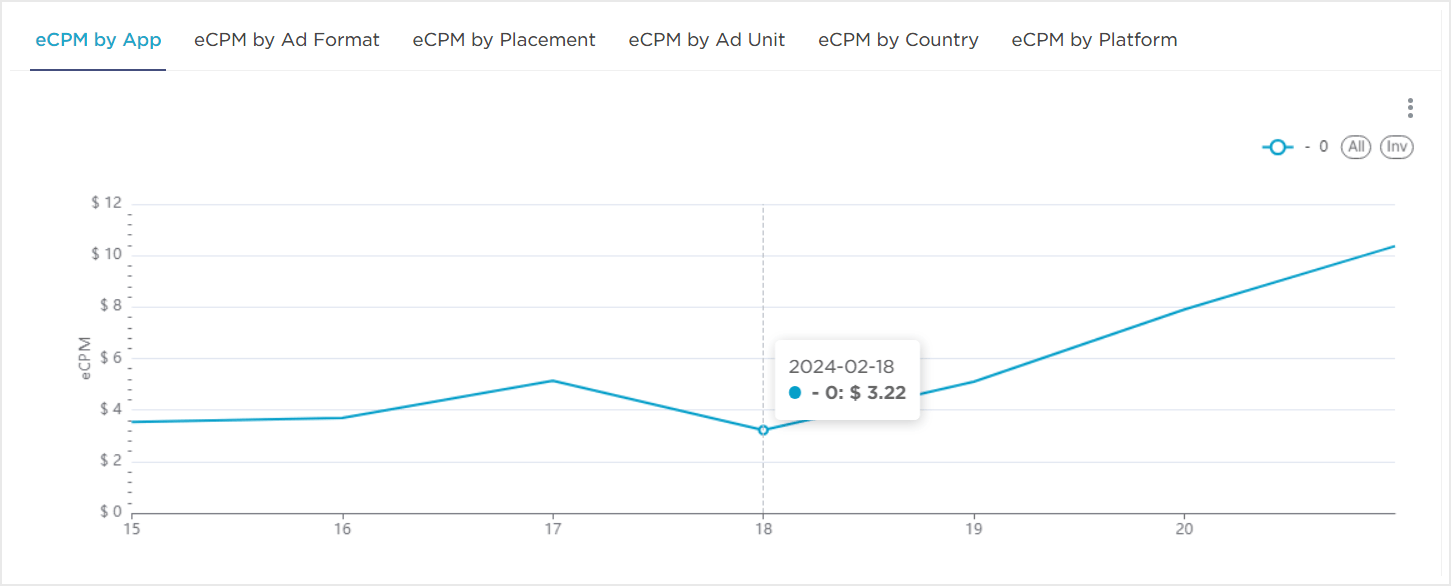
CPM Chart:
The Effective CPM Chart provides a visual breakdown by App, Ad Format, Placement, Ad Unit, Country and Platform. Mousing over the chart will display the associated revenue and date.
The chart also has the ability to force a refresh of the data, enter full screen to review the data or download the data (.CVS, Excel or Image).
